Fig. 7.
Download original image
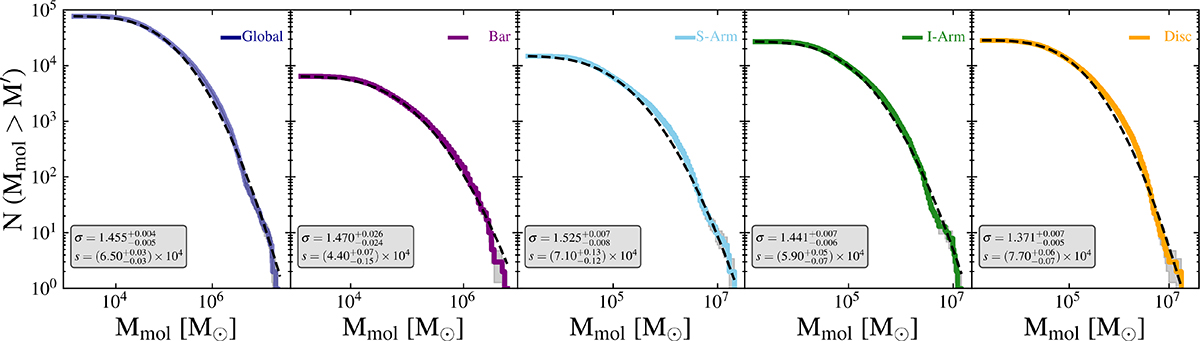
Mass spectra for the PAH clouds in different environments, as labeled in each plot. The dashed black curves show the survival function fits. The fit parameters are displayed in the bottom left corner of each figure, where σ is the shape parameter and s is the scale parameter. The gray region represents the Poisson errors on the counts ![]() .
.
Current usage metrics show cumulative count of Article Views (full-text article views including HTML views, PDF and ePub downloads, according to the available data) and Abstracts Views on Vision4Press platform.
Data correspond to usage on the plateform after 2015. The current usage metrics is available 48-96 hours after online publication and is updated daily on week days.
Initial download of the metrics may take a while.