Open Access
Fig. 8.
Download original image
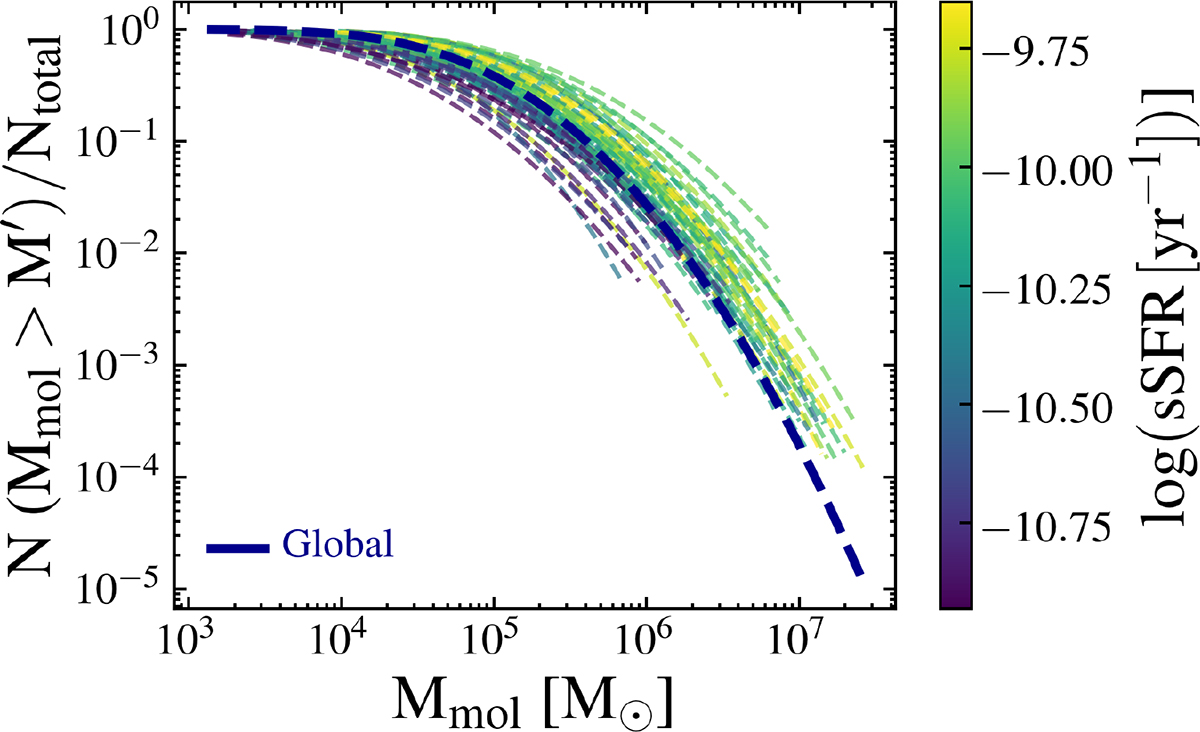
Normalized survival function fits for PAH clouds per galaxy. The dark blue dashed line represents the global fit to the entire sample. The background thin dashed lines are color-coded by specific star formation rate (sSFR) and show the global fits to each galaxy.
Current usage metrics show cumulative count of Article Views (full-text article views including HTML views, PDF and ePub downloads, according to the available data) and Abstracts Views on Vision4Press platform.
Data correspond to usage on the plateform after 2015. The current usage metrics is available 48-96 hours after online publication and is updated daily on week days.
Initial download of the metrics may take a while.