Fig. 9.
Download original image
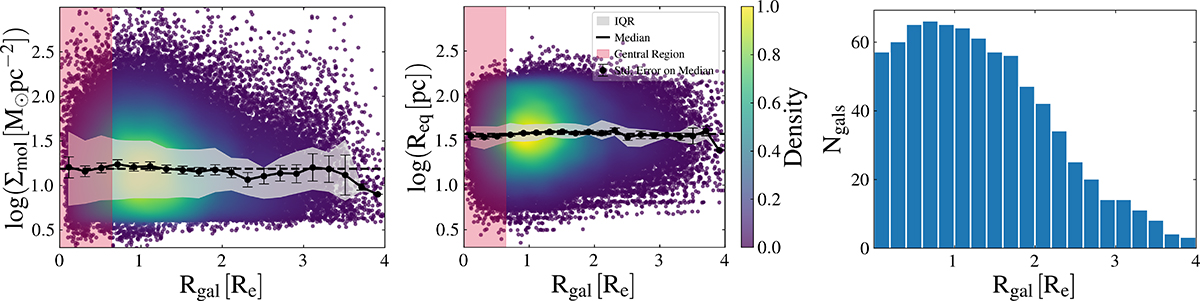
Properties of the PAH clouds vs Rgal for all the clouds in the 66 galaxies: Σmol of the cloud (left), Req (middle), and the total number of galaxies contributing to a specific bin (right). The running galaxy median (filled black circles) is plotted for a bin width of 0.2 Re. The gray-shaded region represents the interquartile range of the medians per galaxy. The error bars on the median are the standard errors (1.253σ/![]() ), where N is the number of galaxies contributing to a specific bin. The background data points represent a scatterplot of the full sample of GMCs colored by the normalized density of clouds. The red-shaded region depicts the maximum extent of the central clouds. The horizontal dashed black line in each plot corresponds to the median of the plotted property.
), where N is the number of galaxies contributing to a specific bin. The background data points represent a scatterplot of the full sample of GMCs colored by the normalized density of clouds. The red-shaded region depicts the maximum extent of the central clouds. The horizontal dashed black line in each plot corresponds to the median of the plotted property.
Current usage metrics show cumulative count of Article Views (full-text article views including HTML views, PDF and ePub downloads, according to the available data) and Abstracts Views on Vision4Press platform.
Data correspond to usage on the plateform after 2015. The current usage metrics is available 48-96 hours after online publication and is updated daily on week days.
Initial download of the metrics may take a while.