Fig. 1.
Download original image
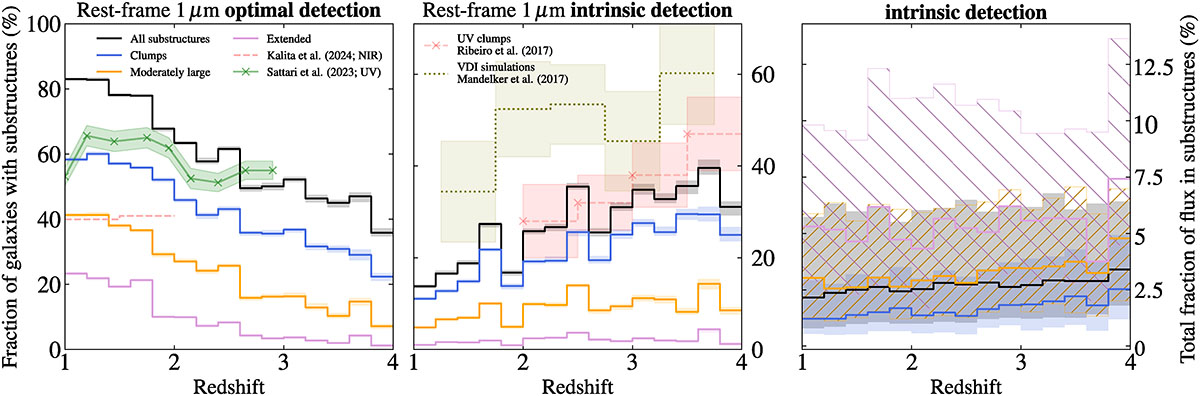
Detection of substructures at a rest-frame wavelength of 1 μm for the entire sample (black) and for three substructure types: clumps (blue), moderately large ones (orange), and extended ones (pink). See Sect. 4.2 for more details. Left: fraction of galaxies with at least one substructure detected with the optimal approach (see Sect. 3.2) as a function of redshift. We show the rest-frame NIR detections carried out by Kalita et al. (2024) (red dashed line) and those in the rest-frame UV by Sattari et al. (2023) (green line and crosses). Middle: same but for the intrinsic detection approach (see Sect. 3.3). We show as a light red line a comparable 2σ detection (kp = 2, see reference) carried out in the rest-frame UV from Ribeiro et al. (2017) and, as a light green line, estimated fractions from the simulations studied in Mandelker et al. (2017, see Appendix D). In both figures on the left-hand side and in the middle, for each sample, we show uncertainties (16th and 84th percentiles) as shaded areas with similar colors. Right: median fraction of flux in substructures as a function of redshift for galaxies with at least one substructure. The uncertainties are shown with a blue shaded area for clumps, a double-dashed orange area for moderately large substructures, a single-dashed pink area for extended substructures, and a black shaded area for the entire sample.
Current usage metrics show cumulative count of Article Views (full-text article views including HTML views, PDF and ePub downloads, according to the available data) and Abstracts Views on Vision4Press platform.
Data correspond to usage on the plateform after 2015. The current usage metrics is available 48-96 hours after online publication and is updated daily on week days.
Initial download of the metrics may take a while.