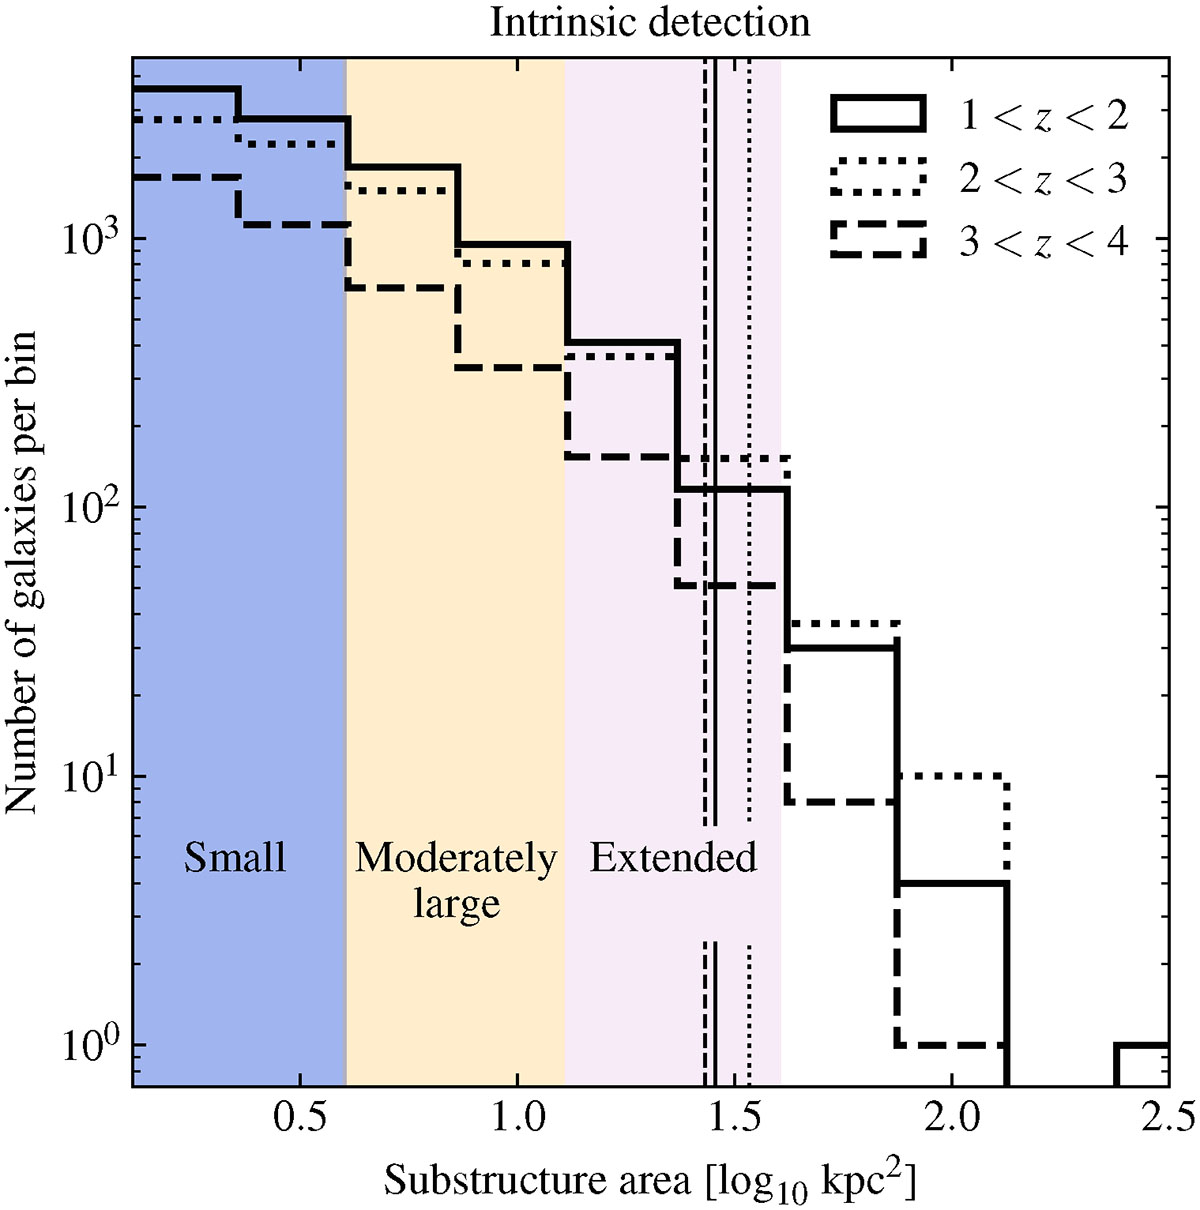
Fig. A.3.
Download original image
Distribution of substructures detected with the intrinsic method (see Sect. 3.3)by area, for three redshift bins: 1 < z < 2 (continuous line), 2 ≤ z < 3 (dotted line), and 3 ≤ z < 4 (dashed line). Vertical lines represent the 99% quantile for each distribution. Background colors indicate the area bins used in the analysis: clumps (blue, 1.3 < S/kpc2 < 4), moderately large substructures (orange, 4 < S/kpc2 < 13), and extended ones (pink, 13 < S/kpc2 < 40).
Current usage metrics show cumulative count of Article Views (full-text article views including HTML views, PDF and ePub downloads, according to the available data) and Abstracts Views on Vision4Press platform.
Data correspond to usage on the plateform after 2015. The current usage metrics is available 48-96 hours after online publication and is updated daily on week days.
Initial download of the metrics may take a while.