Fig. A.5.
Download original image
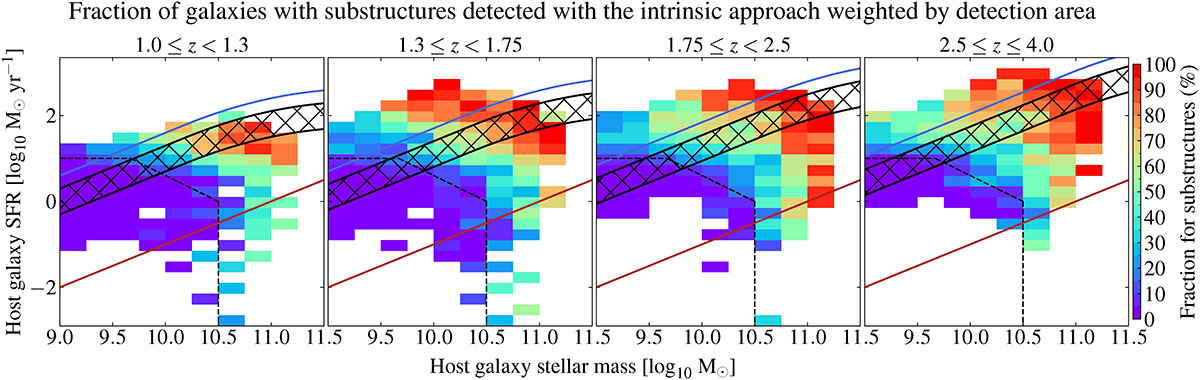
Same as the first row of Fig. 2 but weighting each galaxy by its detection area when computing, in each bin, the average fraction of galaxies with at least one substructure detected with the intrinsic approach. All lines are defined similar to Fig. 2. This shows that our results are not impacted by the detection area of substructures. The same applies to clumps.
Current usage metrics show cumulative count of Article Views (full-text article views including HTML views, PDF and ePub downloads, according to the available data) and Abstracts Views on Vision4Press platform.
Data correspond to usage on the plateform after 2015. The current usage metrics is available 48-96 hours after online publication and is updated daily on week days.
Initial download of the metrics may take a while.