Fig. A.6.
Download original image
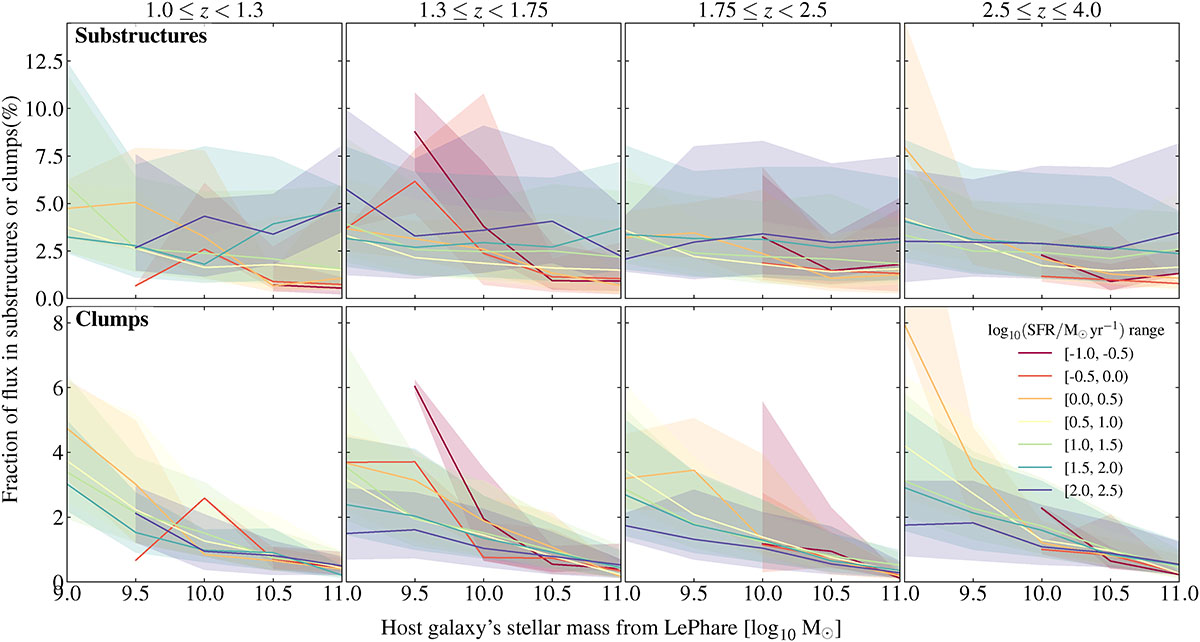
Fraction of rest-frame NIR flux in substructures (top row) and clumps (bottom row) as a function of the host galaxy’s stellar mass in four redshift bins, each bin spanning 1 Gyr of cosmic history. Galaxies are split in different bins of SFR, as illustrated with the various colored lines. The shaded areas correspond to the 16th and 84th percentiles for each SFR bin. See Fig. 3 for an alternative representation.
Current usage metrics show cumulative count of Article Views (full-text article views including HTML views, PDF and ePub downloads, according to the available data) and Abstracts Views on Vision4Press platform.
Data correspond to usage on the plateform after 2015. The current usage metrics is available 48-96 hours after online publication and is updated daily on week days.
Initial download of the metrics may take a while.