Fig. B.1.
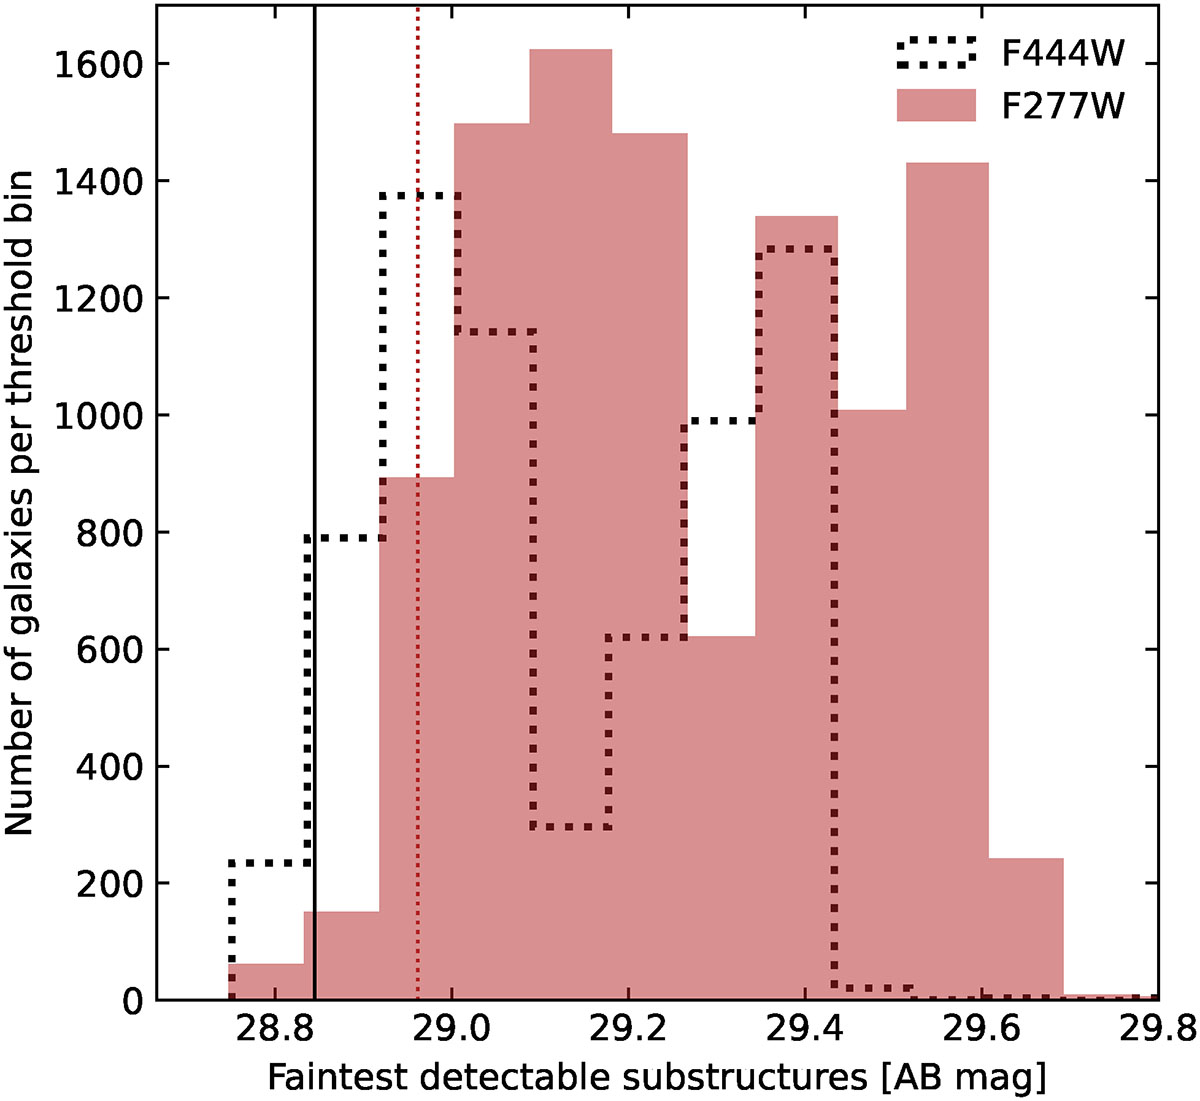
Download original image
Histogram of the faintest detectable substructure in each galaxy. We split between galaxies for which the detection was carried out in the JWST/NIRCam F277W band (1 < z < 2; filled in red) and in the F444W band (2 ≤ z < 4; black dotted line). Vertical lines represent the 5% quartiles for the two bands, that is the values such that 95% of the galaxies have a lower detection threshold. We note that one must add 3.25 mag (or equivalently divide the corresponding flux threshold by 20) to convert these values into the detection threshold applied on each pixel.
Current usage metrics show cumulative count of Article Views (full-text article views including HTML views, PDF and ePub downloads, according to the available data) and Abstracts Views on Vision4Press platform.
Data correspond to usage on the plateform after 2015. The current usage metrics is available 48-96 hours after online publication and is updated daily on week days.
Initial download of the metrics may take a while.