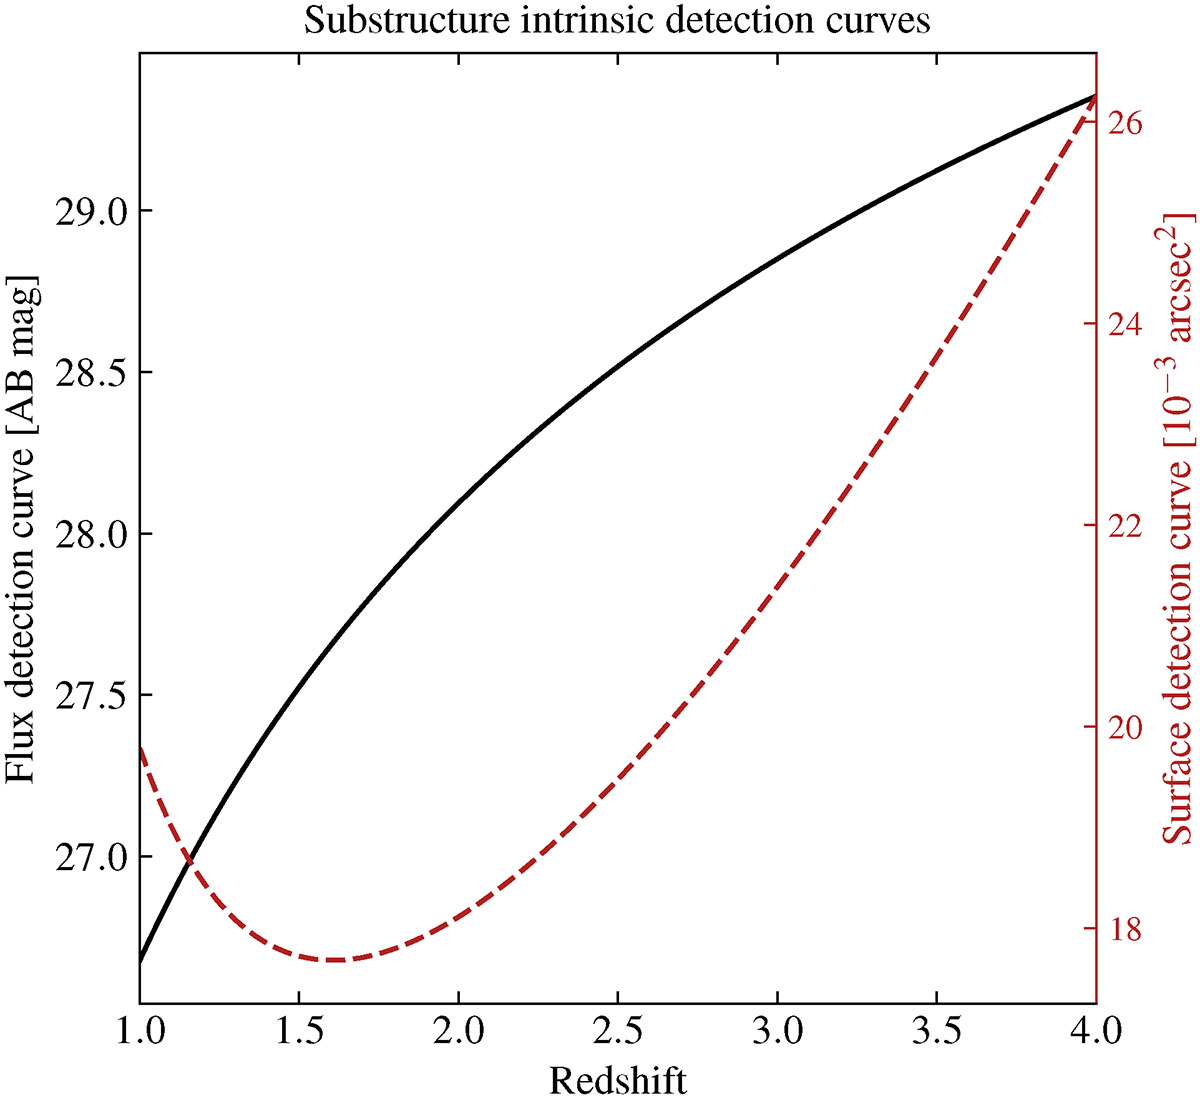
Fig. B.3.
Download original image
Flux and surface detection curves derived in Sect. 3.3 to select substructures with flux and area values that are above thresholds independent of redshift. The black continuous line represents the flux detection curve and the dashed red line represents the surface detection curve. Similar to Fig. B.1, one needs to add 3.25 mag to this curve to obtain the flux detection curve applied to each pixel individually during the substructure detection process.
Current usage metrics show cumulative count of Article Views (full-text article views including HTML views, PDF and ePub downloads, according to the available data) and Abstracts Views on Vision4Press platform.
Data correspond to usage on the plateform after 2015. The current usage metrics is available 48-96 hours after online publication and is updated daily on week days.
Initial download of the metrics may take a while.