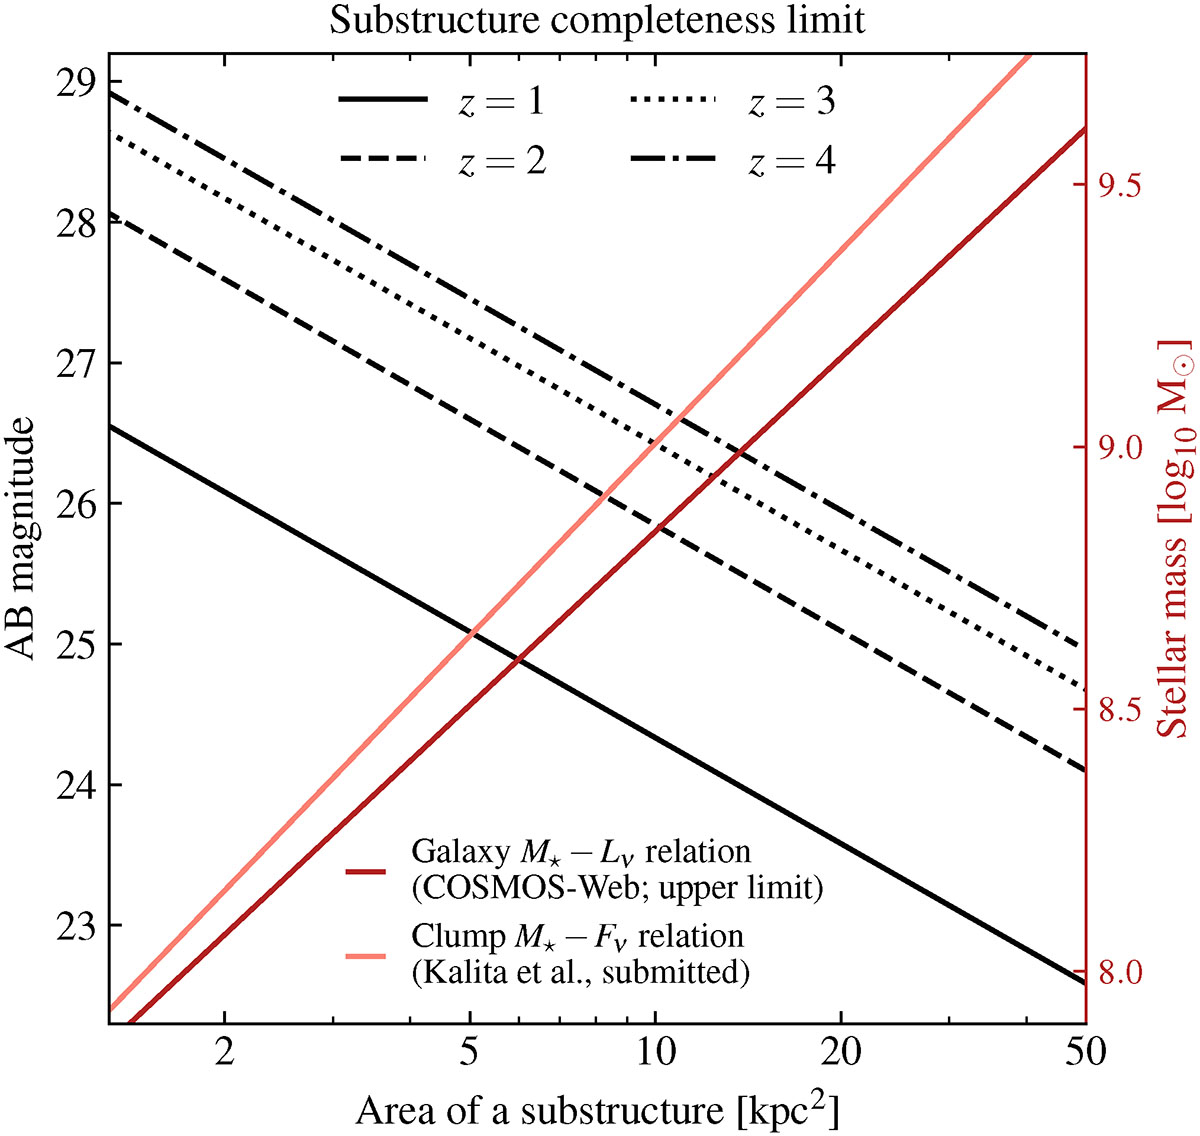
Fig. B.5.
Download original image
Link between the faintest observable magnitude (left vertical axis and black lines) or lowest stellar mass (right vertical axis and red lines) for the intrinsic detection method and the area of substructures. The stellar mass is evaluated at z = 1.5 and is expected to increase by 0.2 dex at z = 4. We estimate it, first, using the best-fit relationship between specific luminosity at a rest-frame wavelength of 1 μm and stellar mass for the entire COSMOS-Web sample (dark red line) and, second, using the best-fit relationship from Kalita et al. (2025b) for clumps in star-forming galaxies at z ≈ 1.5 detected in rest-frame optical (salmon-colored line).
Current usage metrics show cumulative count of Article Views (full-text article views including HTML views, PDF and ePub downloads, according to the available data) and Abstracts Views on Vision4Press platform.
Data correspond to usage on the plateform after 2015. The current usage metrics is available 48-96 hours after online publication and is updated daily on week days.
Initial download of the metrics may take a while.