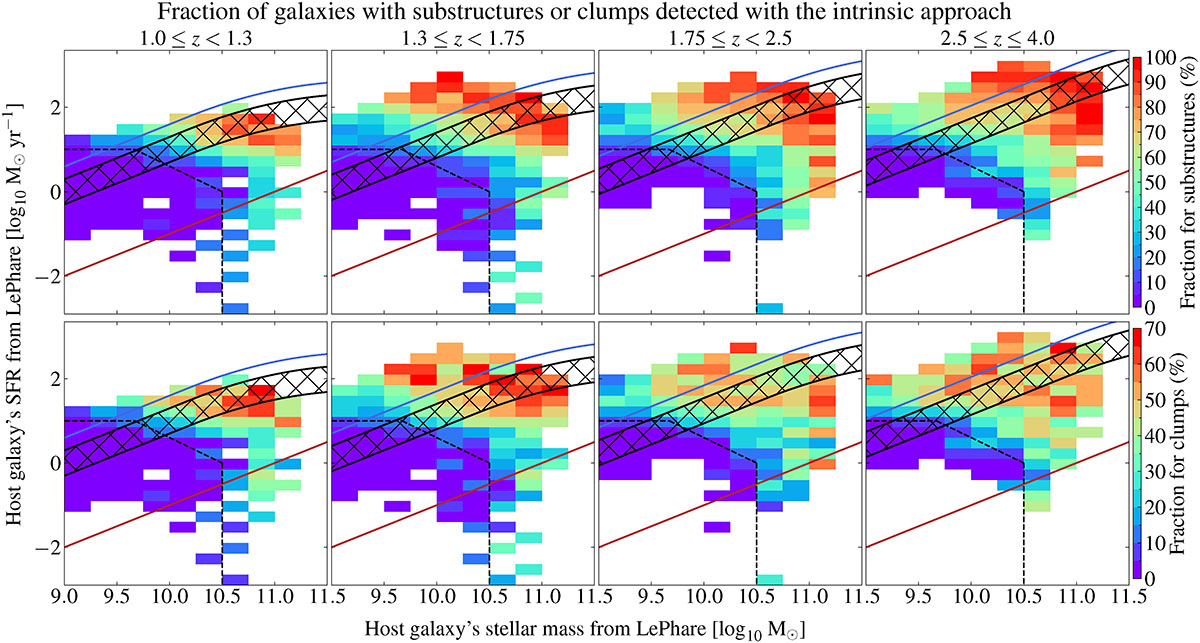
Fig. 2.
Download original image
Top row: Median fraction of galaxies with at least one substructure detected with the intrinsic approach as a function of their host galaxy’s stellar mass and SFR in four redshift bins, each spanning roughly 1 Gyr of cosmic time. Bottom row: Same for clumps. Violet corresponds to 0% and red to 100% for substructures (70% for clumps). In each panel, the dashed line isolates the region where no substructure is detected (see Eq. (4)). Galaxies above the blue line are located in the starburst region, those in the hatched region are on the MS from Schreiber et al. (2015) evaluated at the average redshift of each panel, and those below the red line are in the red sequence with sSFR < 10−11 yr−1. We do not show bins with fewer than ten galaxies.
Current usage metrics show cumulative count of Article Views (full-text article views including HTML views, PDF and ePub downloads, according to the available data) and Abstracts Views on Vision4Press platform.
Data correspond to usage on the plateform after 2015. The current usage metrics is available 48-96 hours after online publication and is updated daily on week days.
Initial download of the metrics may take a while.