Fig. 6.
Download original image
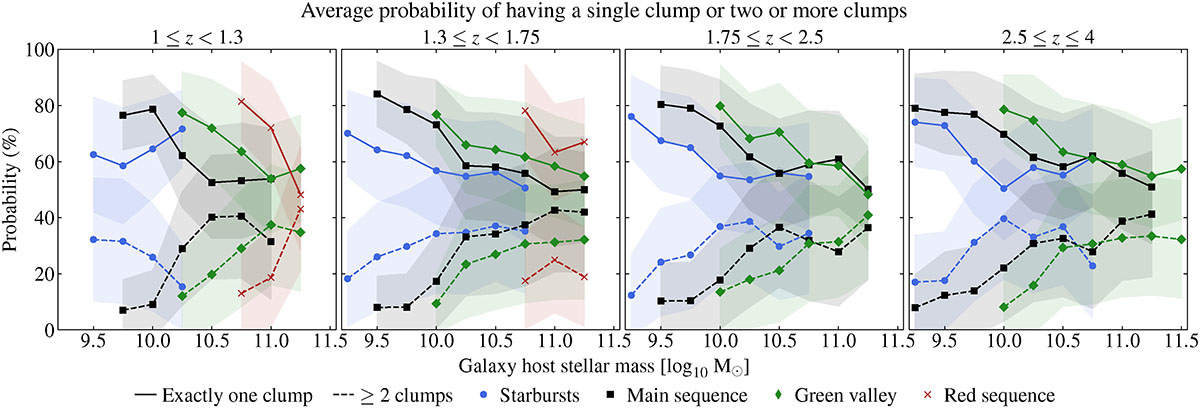
Average probability that a galaxy of a given stellar mass with at least one clump hosts either a single clump (continuous lines) or two or more clumps (dashed lines) for starbursts (blue circles), galaxies on the MS (black squares), in the green valley (green diamonds), and in the red sequence (red crosses). For each class, we show the standard deviation of the probability as a semitransparent filled area with a similar color. The probabilities are computed using Eqs. (C.6) and (C.8).
Current usage metrics show cumulative count of Article Views (full-text article views including HTML views, PDF and ePub downloads, according to the available data) and Abstracts Views on Vision4Press platform.
Data correspond to usage on the plateform after 2015. The current usage metrics is available 48-96 hours after online publication and is updated daily on week days.
Initial download of the metrics may take a while.