Fig. A.1.
Download original image
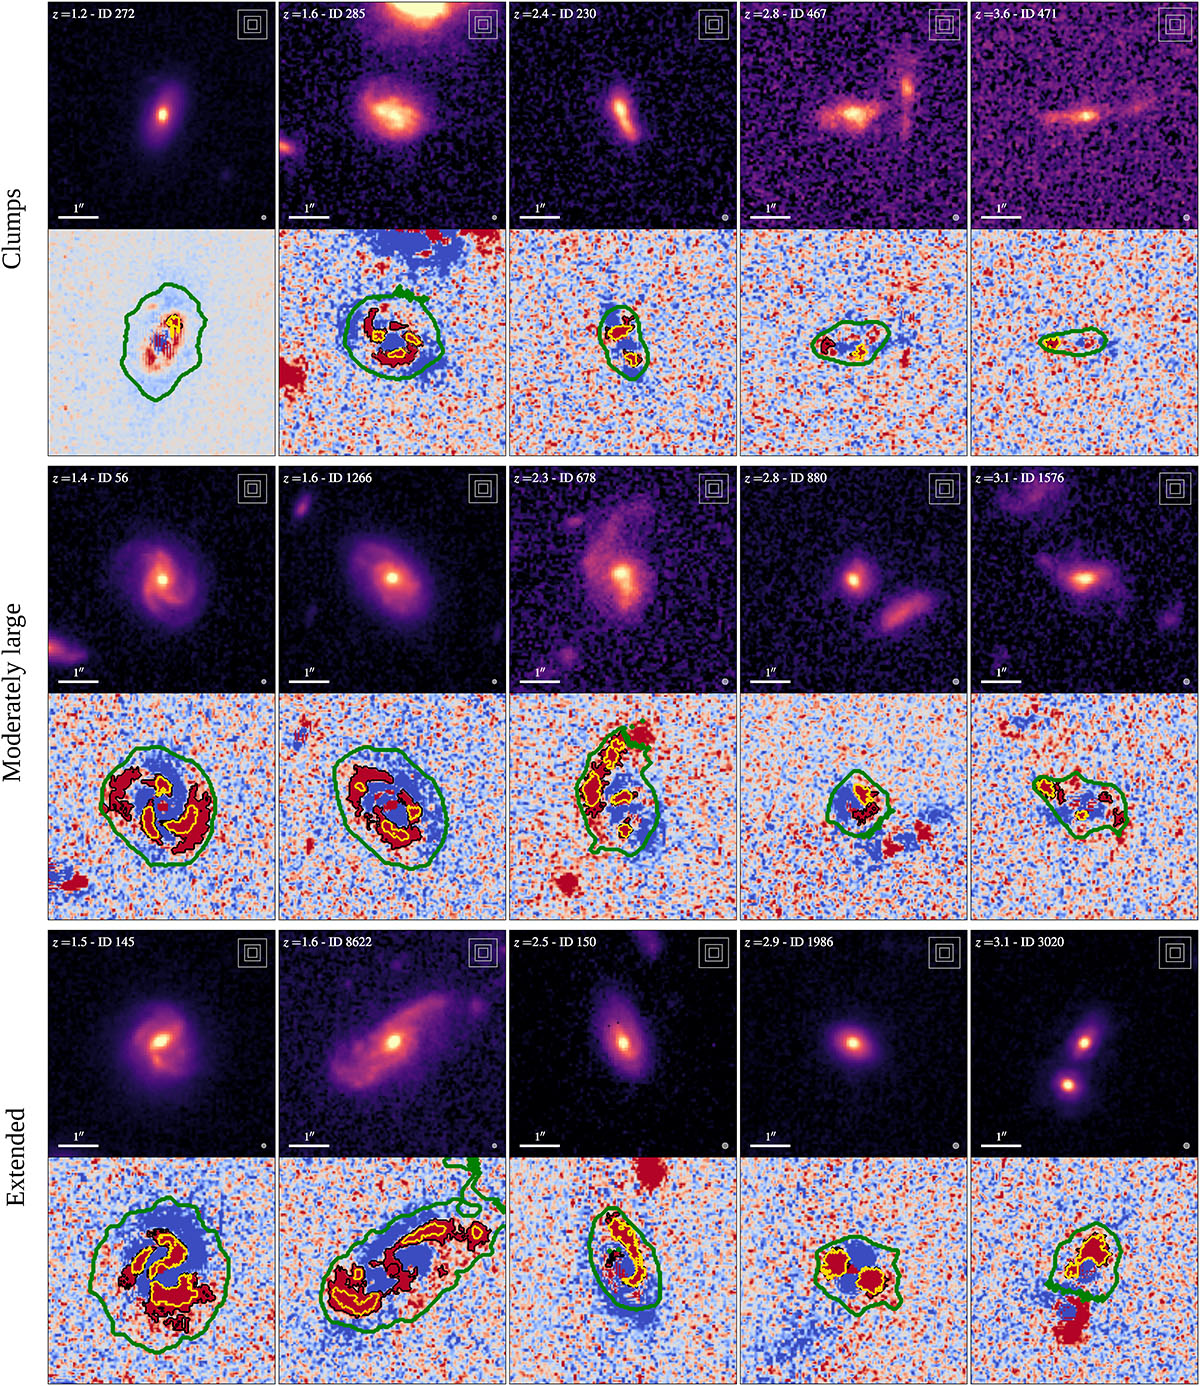
Examples of substructure detections using the optimal (black contours) and intrinsic (yellow contours) approaches. Galaxies are sorted from left to right by increasing redshift and split into three intrinsic substructure classes: clumps, moderately large, and extended (see Sect. 4.2). For each galaxy, we show the image (F277W for 1 < z < 2 and F444W for z > 2) and its residuals below. Red pixels correspond to positive residuals and blue pixels to negative ones. The scale of the residuals is set to ±2σ, with σ the local background fluctuations. In each image, we show the PSF FWHM at the bottom right and upper limits on the area of substructure classes as gray squares at the top right. The residuals show the detection area, highlighted with a thick green contour.
Current usage metrics show cumulative count of Article Views (full-text article views including HTML views, PDF and ePub downloads, according to the available data) and Abstracts Views on Vision4Press platform.
Data correspond to usage on the plateform after 2015. The current usage metrics is available 48-96 hours after online publication and is updated daily on week days.
Initial download of the metrics may take a while.