Open Access
Fig. 3.
Download original image
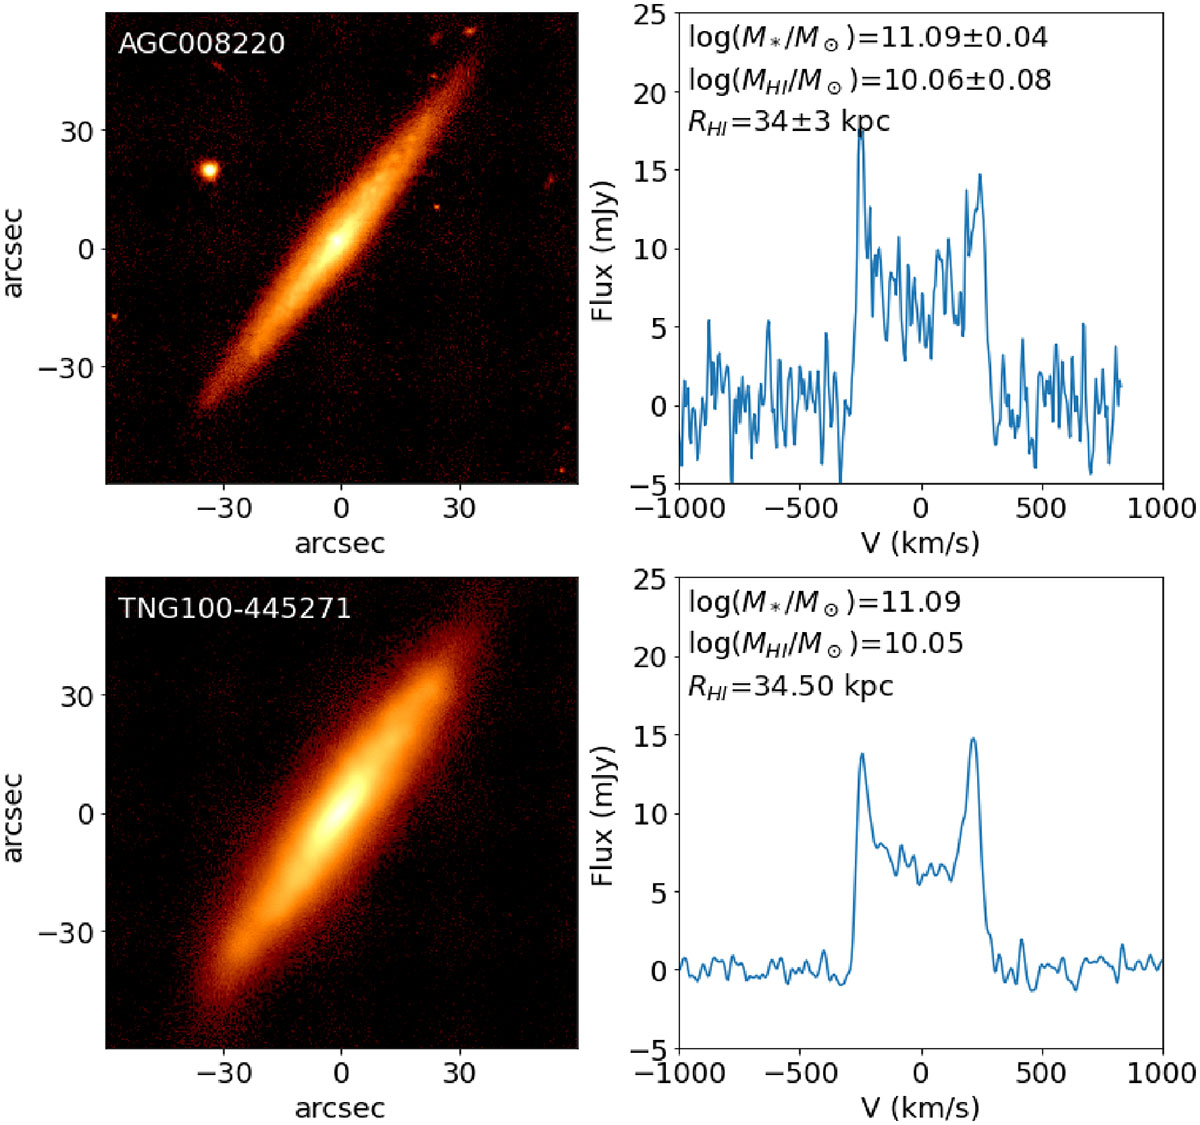
r-band images and H I-integrated spectra for an ALFALFA galaxy AGC008220 (top) and a mock galaxy TNG100-445271 (bottom) from the TNG100 simulation. The H I spectra panels (right) display the corresponding stellar mass, H I mass, and RHI values for each galaxy.
Current usage metrics show cumulative count of Article Views (full-text article views including HTML views, PDF and ePub downloads, according to the available data) and Abstracts Views on Vision4Press platform.
Data correspond to usage on the plateform after 2015. The current usage metrics is available 48-96 hours after online publication and is updated daily on week days.
Initial download of the metrics may take a while.