| Issue |
A&A
Volume 706, February 2026
|
|
|---|---|---|
| Article Number | A64 | |
| Number of page(s) | 11 | |
| Section | Extragalactic astronomy | |
| DOI | https://doi.org/10.1051/0004-6361/202555983 | |
| Published online | 29 January 2026 | |
Dark matter in ALFALFA galaxies
Investigating galaxy-halo connection
1
Shanghai Astronomical Observatory, Chinese Academy of Sciences 80 Nandan Road Shanghai 200030, China
2
Max Planck Institute for Radio Astronomy Auf dem Hügel 69 53121 Bonn, Germany
3
National Astronomical Observatories, Chinese Academy of Sciences, A20 Datun Road Chaoyang District Beijing 100101, China
★ Corresponding authors: This email address is being protected from spambots. You need JavaScript enabled to view it.
, This email address is being protected from spambots. You need JavaScript enabled to view it.
Received:
17
June
2025
Accepted:
15
December
2025
Abstract
Aims. This paper aims to investigate the galaxy-halo connection using a large sample of individual galaxies with H I-integrated spectra. We determined their dark matter content by applying a dynamical method based on H I line widths measured with the curve-of-growth technique, together with inclination corrections inferred from optical images.
Methods. We built a sample of 2453 gas-rich, predominantly late-type galaxies spanning a stellar mass range of 108.7 M⊙ to 1011.4 M⊙ by matching them one-to-one with their counterparts from the ALFALFA survey and the TNG100 simulation, ensuring a direct match of stellar mass and H I radius. We generated mock images and mock H I-integrated spectra for TNG100 galaxies, and applied the same dynamical method to both ALFALFA and TNG100 mock galaxies to infer their dark matter masses.
Results. Across all stellar mass bins, ALFALFA galaxies exhibit lower median dark matter masses than the mock TNG100 simulation results. In each bin, this offset is driven by a tail of galaxies with comparatively low dark matter content, which becomes more prominent toward higher stellar masses. In the highest mass bin (M* > 1011 M⊙), late-type ALFALFA galaxies show a median dark matter mass that is 23% lower than that of their counterparts in the TNG100 dark-matter-only simulation, with 32% of ALFALFA galaxies having MDM(< RHI) < 1011.5 M⊙, compared to 17% in the mock TNG100 sample. These results suggest that a larger fraction of massive late-type galaxies reside in relatively less massive dark matter haloes than predicted by the TNG100 simulation.
Key words: galaxies: formation / galaxies: halos / galaxies: kinematics and dynamics
© The Authors 2026
 Open Access article, published by EDP Sciences, under the terms of the Creative Commons Attribution License (https://creativecommons.org/licenses/by/4.0), which permits unrestricted use, distribution, and reproduction in any medium, provided the original work is properly cited.
This article is published in open access under the Subscribe to Open model. This email address is being protected from spambots. You need JavaScript enabled to view it. to support open access publication.
1. Introduction
In cosmological models, galaxies form in the central potential well of dark matter haloes. The density profiles of dark matter haloes are determined by the attributes of dark matter particles: Without the baryonic effect, cold dark matter forms central cusps (e.g. Navarro et al. 1996; Springel et al. 2008) while self-interacting warm dark matter forms flatter cores (e.g. Kaplinghat et al. 2016; Kamada et al. 2017).
The connection between galaxies and their dark matter haloes also affects the amount of dark matter in galaxies. The stellar-to-halo mass relation (SHMR) and its scatter have been measured in various approaches, such as abundance matching (e.g. Moster et al. 2010; Behroozi et al. 2010; Reddick et al. 2013), galaxy clustering (e.g. Zheng et al. 2007; Yang et al. 2009; Zu & Mandelbaum 2015; Tinker et al. 2017), satellite kinematics (e.g. Conroy et al. 2007; More et al. 2011; Wojtak & Mamon 2013), galaxy-galaxy lensing (e.g. Mandelbaum et al. 2006, 2016; Huang et al. 2020; Bilicki et al. 2021, and empirical models (e.g. Rodríguez-Puebla et al. 2015; Behroozi et al. 2019). The halo mass is typically defined as M200, the mass enclosed within a sphere of mean density 200 times the critical density of the Universe. These findings indicate that massive galaxies reside in massive dark matter haloes, and the scatter of SHMR is influenced by galaxy colours or morphologies, with dark matter haloes of early-type galaxies being more massive than those of late-type galaxies with equivalent stellar mass, especially at the high-mass end. However, most of these results are obtained by stacking the weak or undetectable signals of individual galaxies from large samples.
The direct determinations of SHMR require dark matter measurements in individual galaxies. Large samples of stellar kinematic data from spatially resolved integral field unit (IFU) spectrographs have been used to build dark matter distributions in galaxies (Cappellari et al. 2013; Santucci et al. 2022; Zhu et al. 2023). However, the limited field-of-view of these measurements covering galaxy bright central regions can only measure dark matter distributions within a few effective radii of galaxies with significant uncertainties, which might only provide constraints on baryonic feedback during galaxy formation. Extended IFU and long-slit spectrographs (e.g. Forestell & Gebhardt 2010; Boardman et al. 2016; Comerón et al. 2023) and other tracers such as H I rotation curves (e.g. de Blok et al. 2008; Oh et al. 2011; Li et al. 2020; Harris et al. 2020; Yang et al. 2020; Cooke et al. 2022), planetary nebulae and globular clusters (e.g. Alabi et al. 2016, 2017; Dumont et al. 2024), hot interstellar X-ray gas (e.g. Harris et al. 2019, 2020), and stellar streams (Pearson et al. 2022; Nibauer et al. 2023) can probe dark matter on the outskirts of extragalactic galaxies, yet there is no large sample because of the expensive observations. Until now, direct determinations of SHMR have been reported only in a handful of studies. These include analyses of central galaxies in galaxy groups and clusters (Kravtsov et al. 2018; Erfanianfar et al. 2019), as well as dynamical studies of individual galaxies using H I kinematics (Posti et al. 2019; Mancera Piña et al. 2022; Di Teodoro et al. 2023; Biswas et al. 2023; de Isídio et al. 2024) or globular cluster kinematics (Posti & Fall 2021).
For a better understanding of the connection between galaxies and their halos, it is essential to establish dark matter measurements at extended radii for large samples of individual galaxies. Compared to other time-consuming tracers, H I-integrated spectra provide a cost-effective method to estimate dark matter content. For gas in dynamic equilibrium, using the rotational velocity derived from the H I line width in conjunction with the galaxy sizes is the most efficient method to estimate galaxy dynamical mass (e.g. Casertano & Shostak 1980; Broeils & Rhee 1997; Koribalski et al. 2018) and even dark matter halo mass M200 (Yu et al. 2020). The Arecibo Legacy Fast ALFA survey (ALFALFA; Haynes et al. 2018) identified approximately 31500 extragalactic H I emissions within the redshift of about 0.06, and its spectra have been applied to provide measurements of the dynamical mass within the H I radius of galaxies (Yu et al. 2022), which can be used to further deduce the dark matter mass within the H I radius. However, we cannot obtain the virial mass of dark matter haloes directly from such measurements; therefore, we need to compare these measurements with the dark matter mass within the H I radius for galaxies in cosmological simulations for a meaningful interpretation, as earlier studies have contrasted the measured SHMR with multiple simulations (e.g. Correa & Schaye 2020; Cui et al. 2021; Wang & Peng 2025) and compared the dark matter content within large radii of observations and simulations (e.g. Alabi et al. 2017; Lovell et al. 2018; Harris et al. 2020; Yang et al. 2024), highlighting that observations show larger scatter in the SHMR, with a higher portion of galaxies exhibiting lower dark matter fractions compared to simulations.
This paper aims to explore the galaxy-halo connection by investigating the dark matter mass within the H I radius for galaxies in the ALFALFA survey and the IllustrisTNG simulation. The structure is as follows: In Section 2, we introduce the method for measuring the dark matter content in galaxies; Section 3 covers data and sample description. In Section 4, the method is validated by applying it to mock galaxies in the simulation and comparing those results with true values; we present the dark matter mass of the ALFALFA galaxies alongside comparisons with the simulation. We discuss our main result in Section 5. The paper is summarised with Section 6.
2. Methods
The technique for determining galaxy dynamical mass using the H I line width from an H I-integrated spectrum via the curve-of-growth method and the inclination from an optical image is detailed in Yu et al. (2020, 2022). In this section, we provide a brief overview of this technique and introduce the method that is subsequently used to measure the dark matter content.
The observational axis ratio q is measured from the optical image. Assuming an intrinsic disc thickness q0 varying with the stellar mass M* according to the relation presented in Sánchez-Janssen et al. (2010), the galaxy inclination i is then
 (1)
(1)
The H I-integrated spectrum is used to measure the H I line width V85, which is the velocity width that captures 85% of the total flux. A rotation velocity V85, c is then derived by correcting for the inclination (observational effects are omitted in this equation but included in measurements)
 (2)
(2)
The circular velocity Vc at the H I radius RHI is further derived by this scaling relation (see Equation 9 of Yu et al. 2020 for details),
 (3)
(3)
The H I radius RHI is defined by where the H I column density falls to 1 M⊙ pc−2. The H I mass MHI measured from the total flux of the H I-integrated spectrum has a tight empirical correlation with RHI in isolated gas-rich galaxies, such as the calibration in Wang et al. (2016),
 (4)
(4)
The dynamical mass within RHI is then derived by
 (5)
(5)
The baryonic mass within RHI includes the stellar, atomic, and molecular gas components. The stellar mass within RHI is taken as the stellar mass of the galaxy M*, since RHI typically extends beyond the stellar disc in gas-rich galaxies. The atomic gas mass is 1.33 MHI(< RHI) to account for helium, where MHI(< RHI) is obtained by integrating the total HI mass MHI assuming the normalised surface density profile of Wang et al. (2014):
 (6)
(6)
where r = R/RHI, and we use α = 39.878, rs = 0.188, rc = 0.183, with Σ0 treated as a variable central density to ensure the integral equals MHI. The molecular gas is estimated from the star formation rate as follows Hagedorn et al. (2024):
 (7)
(7)
The baryonic mass within RHI is then
 (8)
(8)
The enclosed dark matter mass within RHI is finally derived by
 (9)
(9)
3. Data and sample
Our goal is to understand the SHMR of galaxies. However, the available observational data – optical images and H I-integrated spectra – provide only a single measurement of the enclosed dark matter mass within the H I radius MDM(< RHI) for each galaxy, with RHI varying from galaxy to galaxy. To interpret the observed MDM(< RHI) in the context of the SHMR, we compare these measurements with mock observations from the TNG100 simulation. By applying the same measurement procedure to the simulated galaxies, we quantify the systematic biases introduced by our method. In this section, we describe the observational datasets, introduce the simulated galaxies, and outline the procedure for generating mock observations and performing the one-to-one matching between the observational and simulated samples.
3.1. Observational data
We chose our parent sample from the catalogue presented in Yu et al. (2022), which is the overlap of the ALFALFA survey, the 16th data release of the Sloan Digital Sky Surveys (SDSS DR16 Ahumada et al. 2020) and the second version of the GALEX-SDSS-WISE Legacy Catalogue with the deepest photometry (GSWLC-X2; Salim et al. 2016, 2018). This catalogue measures the H I mass, the H I radius RHI and the circular velocity Vc from the H I-integrated spectra of the ALFALFA survey to provide the dynamical mass within RHI. It also collects optical and spectroscopic parameters including the r-band axis ratio q from SDSS DR16 and the stellar mass M* and the star formation rate (SFR) measured with UV/optical/IR SED fitting from GSWLC-X2.
We also required that these parameters reported in the catalogue for the parent sample meet the following criteria:
-
The difference between the recession velocity of the optical spectra and the central velocity of the H I spectra is required to be less than 30 km/s. This threshold is motivated by the observed distribution of velocity offsets: most galaxies lie within this range, whereas larger differences (up to ∼200 km s−1) may indicate misidentifications, unsettled discs, strong misalignments, or external disturbances such as ram-pressure stripping. In the absence of resolved velocity fields, such systems cannot be reliably identified, and the cut therefore serves as a conservative safeguard to select galaxies where the H I gas is likely in dynamical equilibrium.
-
The signal-to-noise ratio of the H I-integrated spectrum is required to exceed 3.0 to ensure robust detections.
-
The H I concentration parameter CV is required to be below 4.0. This parameter, defined as the ratio between the line widths V85 and V25 (Yu et al. 2022), characterises the degree of concentration of the integrated profile. Values below this threshold correspond to broader, double-horned spectra, whereas higher values indicate more centrally concentrated, single-peaked profiles. The adopted cut effectively selects galaxies with double-horned spectra, as confirmed by inspection of our sample.
-
The inclination derived from the optical axis ratio is required to satisfy sin(i)≥0.7 (i ≳ 45°). This cut ensures that galaxies are nearly edge-on, thereby reducing uncertainties in the deprojection of velocities and enabling accurate dynamical mass estimates (see Appendix A for details).
We finally conducted a visual inspection of galaxy images to exclude irregular and face-on bar galaxies. This results in a parent sample of 4844 galaxies. We show the normalised H I spectra of the parent sample in Figure B.1 (see Appendix B) to illustrate the typical double-horned line profiles of rotation-supported discs. We obtained the baryonic mass within RHI and derived the enclosed dark matter mass and dark matter fraction within RHI for this parent sample.
3.2. Simulated data
The IllustrisTNG project consists of a suite of state-of-the-art hydrodynamic cosmological simulations in large cosmological volumes. We utilised the ‘TNG100-1’ simulation, which has a cubic volume with a side length of 110.7 Mpc, a baryonic mass resolution of 1.4 × 10⁶ M⊙, and a dark matter resolution of 7.5 × 10⁶ M⊙. We used the snapshot 99 which corresponds to z = 0. We also utilised the dark-matter-only simulation called ‘TNG100-1-Dark’, which has a dark matter resolution of 8.9 × 10⁶ M⊙.
We generated mock SDSS r-band images for TNG100 galaxies using the method described in Cai et al. (2025) by projecting each galaxy onto a two-dimensional plane in a random direction. From these mock images, we measured the effective radii Re and the axis-ratios q. We defined the stellar mass M* as the total mass of stellar particles contained within 5Re to estimate the intrinsic disc thickness q0. The inclination i was subsequently derived from the axis-ratio and the intrinsic disc thickness.
The H I spatial distribution for TNG100 galaxies was generated with the Hdecompose package1. This implementation calculates the neutral gas fraction of each gas particle based on the multiphase ISM model detailed in Springel & Hernquist (2003). We utilised the ‘volumetric’ method as outlined in Diemer et al. (2018) and originally introduced by Lagos et al. (2015) to calculate the molecular gas fraction, employing the H2 model by Gnedin & Kravtsov (2011).
We described the H I emission from each gas particle with a Gaussian profile centred on the velocity of the particle. We then created mock observations by placing each galaxy at an identical distance to its observational counterpart (see Section 3.3 for a sample matching strategy), observing them from the same directions as the optical images. The H I-integrated spectra resembling those from the ALFALFA survey were obtained by convolving them with a beam size of 212 arcsec (approximating the Arecibo beam of ∼3.8′×3.3′) and a channel width of 5.5 km/s, both consistent with the ALFALFA observational setup (Haynes et al. 2011, 2018). We also applied a Hanning smooth, a standard spectral smoothing that reduces channel-to-channel noise fluctuations, yielding a final velocity resolution of 10 km/s, and then added random Gaussian noise equivalent to the ALFALFA noise level. This H I-integrated spectra obtained allowed us to measure the H I line width V85.
An observation-equivalent definition of MHI is required for the TNG100 galaxies. Although IllustrisTNG reproduces the overall H I size–mass relation consistent with observations (Stevens et al. 2019), using the total H I mass together with the ‘true’ H I radius at which the H I column density drops to 1 M⊙ pc−2 leads to a systematic offset from the empirical MHI − RHI relation, because the total H I mass includes a significant amount of diffuse halo gas. We therefore defined the H I mass as that enclosed within 2.2 times the ‘true’ H I radius. With this definition, the simulated galaxies reproduce the observed MHI − RHI relation of Wang et al. (2016) with small scatter (see Appendix C for details).
We finally derived the observed-style RHI from MHI using their empirical correlation. We used these mock images and integrated spectra H I to determine the dynamical and baryonic mass within RHI using the exact same method as for observation, as described in Section 2. The baryonic mass was computed using the actual stellar mass within 5Re and the H I mass within RHI. This approach yielded an observed-style enclosed dark matter mass within RHI for each galaxy in the sample.
We defined the values of the TNG100 mass properties on the basis of the particle counts as the ground truth for method validation. The true dynamical mass within RHI was obtained by adding the masses of all particles (including stellar, gas and dark matter) within RHI. We also identified the counterparts of the TNG100 galaxies in the dark-matter-only simulation ‘TNG100-1-dark’ using the Subhalo Matching To Dark catalogue provided by the IllustrisTNG project. We computed the corresponding enclosed dark matter mass within RHI and scale it to account for the difference in dark matter particle masses between the TNG100-dark and TNG100 simulations. This yielded Mdark(< RHI), representing the dark matter distribution independent of baryonic effects (e.g. Navarro et al. 1996; Springel et al. 2008).
3.3. Sample matching
The enclosed dark matter mass within RHI is influenced not only by the dark matter halo mass, which correlates with stellar mass, but also by the enclosed radius RHI itself. To ensure a fair comparison between observational and simulated galaxies, we therefore performed a nearest-neighbour one-to-one matching on the M* − RHI plane for the ALFALFA parent sample and the TNG100 H I galaxies, requiring that the matched pairs differ by no more than 0.05 dex in M* and 0.02 dex in RHI.
This matching resulted in a final sample comprising 2453 galaxies from the ALFALFA survey, each paired with a corresponding TNG100 galaxy. Figure 1 demonstrates the M* − RHI distribution, along with histograms of the RHI distribution for the matched samples. The matched ALFALFA sample has a stellar mass range from 108.7 to 1011.4 M⊙, narrower than that of the ALFALFA parent sample. Figure 2 shows the colour–magnitude diagram of the matched ALFALFA galaxies, indicating that the sample is dominated by star-forming galaxies. Figure 3 presents the r-band images and H I-integrated spectra for an ALFALFA galaxy and its corresponding mock galaxy from TNG100. The paired galaxies exhibit similar morphology and spectral features, and have similar stellar and H I masses, resulting in comparable H I radii.
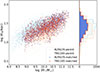 |
Fig. 1. Left: the ALFALFA matched sample galaxies (blue) and the TNG100 matched sample (red) on the log(M*)−log(RHI) plane. We plot the ALFALFA parent sample (light blue) and TNG100 H I galaxies (orange) in the background. Right: RHI distribution for the aforementioned samples plotted in the same colour scheme. |
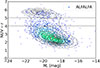 |
Fig. 2. Colour-magnitude diagram for the sample galaxies. The ALFALFA sample is displayed with varying colours representing density and consists primarily of star-forming galaxies. Additionally, the NASA-Sloan Atlas catalogue is shown in the background with the contour lines (Blanton et al. 2011). |
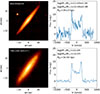 |
Fig. 3. r-band images and H I-integrated spectra for an ALFALFA galaxy AGC008220 (top) and a mock galaxy TNG100-445271 (bottom) from the TNG100 simulation. The H I spectra panels (right) display the corresponding stellar mass, H I mass, and RHI values for each galaxy. |
4. Results
In this section, we show the characteristics of the dynamical and dark matter mass within RHI for the ALFALFA sample and the TNG100 sample with well-matched M* and RHI. We divide both samples into five mass bins according to the stellar mass of the TNG100 sample in all matched pairs, ensuring an equal number of ALFALFA and TNG100 galaxies in each mass bin. The first four bins contain roughly 490−750 galaxies each, while the highest-mass bin is smaller, containing only 132 galaxies. In the following context, the results obtained from the mock observations of the TNG100 sample are denoted as the TNG100-mock, and the true values of the TNG100 sample are denoted as the TNG100-true.
4.1. Dynamical mass
We plot the histograms of the enclosed dynamical mass within RHI for the ALFALFA sample and the TNG100 sample and show the median value for each data set in Figure 4. We also perform pairwise statistical tests to assess differences between the distributions of the enclosed dynamical masses within RHI for TNG100-mock and TNG100-true, and for ALFALFA and TNG100-mock across stellar mass bins, with the bin number indicated as well as the corresponding statistical results in Table 1. Specifically, we compute the Mann–Whitney–Wilcoxon (MWU; Wilcoxon 1945; Mann & Whitney 1947) p-value, which tests for a shift in the median between two samples; the Cliff’s δ (Cliff 1993, 1996), which quantifies the direction and magnitude of the distributional shift between the two samples; and the Kolmogorov–Smirnov (KS; An 1933; Smirnov 1939) p-value, which tests whether two samples are drawn from the same parent distribution. For the MWU and KS tests, a low p-value (typically < 0.05) indicates that the null hypothesis (the two samples are drawn from the same parent distribution) can be rejected with ≥95% confidence. In this work, we adopt a more conservative reference threshold of 0.01 to highlight only the most robust differences. For Cliff’s δ, we follow standard interpretations, where |δ|< 0.11 corresponds to a negligible shift between distributions. These conventions allow us to distinguish statistically significant differences from negligible ones that are too small in magnitude to affect our scientific conclusions.
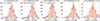 |
Fig. 4. Histograms of the enclosed dynamical mass within RHI for the ALFALFA sample and the TNG100 sample in five mass bins. The measurements for the ALFALFA sample are shown in blue, the true values of the TNG100 sample (TNG100-true) are plotted in orange, and the results obtained from the mock observations of the TNG100 sample (TNG100-mock) are shown in red. Median values for each dataset are indicated by a vertical dashed line matching the colour of the sample. |
Pairwise statistical tests of the enclosed dynamical masses within RHI across stellar mass bins.
The method for measuring dynamical mass introduces minimal bias: compared to TNG100-true, the median dynamical masses within RHI for TNG100-mock are higher by < 3% in the first three stellar-mass bins, lower by 5.3% in the fourth bin, and lower by 12.5% in the highest-mass bin. This conclusion is supported by statistical tests: the MWU p-values exceed 0.01 and the absolute values of Cliff’s δ are below 0.11 in all bins, indicating negligible systematic shifts in the median values. Additionally, the KS p-values in the three massive bins are higher than 0.01, providing further evidence that the distributions of dynamical masses within RHI for TNG100-mock and TNG100-true are statistically consistent in these bins. For the two lowest-mass bins, the KS p-values are lower than 0.01, indicating that the full distributions are not identical; however, the median values differ by less than 3%, suggesting that these distributional discrepancies do not introduce a significant systematic bias in the measurement of dynamical mass.
The median dynamical masses within RHI for the ALFALFA sample are systematically lower than those of the TNG100-mock across five stellar mass bins, with the difference minimal in the lowest mass bin and increasing towards higher mass bins. Pairwise MWU tests and Cliff’s δ indicate only slight shifts in low-mass bins (small effect, |δ|≲0.11; MWU p < 0.01), with negative δ values showing that ALFALFA tends to have lower dynamical masses. In the highest mass bin the shift becomes more pronounced (δ = −0.24), largely driven by ∼21% of ALFALFA galaxies having Mdyn(< RHI) < 1011.6 M⊙ compared to 9% of TNG100-mock galaxies with such low dynamical masses. KS tests further confirm the trend of increasing differences with stellar mass: in the lowest-mass bin, the difference is relatively small (p ∼ 0.11), while in the intermediate bins the differences are statistically significant (p < 0.01). The higher p-value in the highest-mass bin (p ∼ 0.17) is mainly due to the small sample size in this bin (132 galaxies, less than 25% of the other bins) and does not contradict the overall trend of larger differences at higher stellar mass.
4.2. Dark matter halo mass
We show the histograms of the enclosed dark matter mass within RHI for the ALFALFA sample and the TNG100 sample in Figure 5. We also report MWU p-values, Cliff’s δ, and KS p-values for the distributions of the enclosed dark matter masses within RHI, comparing TNG100-mock with TNG100-true and ALFALFA with TNG100-mock across stellar mass bins, with the bin number and the corresponding statistical results shown in Table 2.
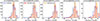 |
Fig. 5. Histograms of the enclosed dark matter mass within RHI for the ALFALFA sample and the TNG100 sample in five mass bins. The measurements for the ALFALFA sample are shown in blue, the true values of the TNG100 sample (TNG100-true) are plotted in orange, and the results obtained from the mock observations of TNG100 sample (TNG100-mock) are shown in red. Median values for each dataset are indicated by a vertical dashed line matching the colour of the sample. |
Pairwise statistical tests of the enclosed dark matter masses within RHI across stellar mass bins.
The enclosed dark matter mass within RHI for the TNG100-mock is generally consistent with that of the TNG100-true in the two high-mass bins, suggesting that methodological biases in the dark matter measurements are small for massive galaxies. In these high-mass bins, the MWU p-values are higher than 0.01 with |δ|< 0.11, and the KS p-values exceed 0.01, indicating negligible systematic shifts in the median values and statistically consistent distributions. In contrast, in the three low-mass bins (M* ≲ 1010.5 M⊙), the TNG100-mock tends to yield slightly higher enclosed dark matter masses than the true values. This is reflected by MWU p-values well below 0.01 with positive δ (0.11 − 0.18), and very small KS p-values (p < 10−4), indicating statistically significant shifts in the full distributions. These discrepancies reflect differences in measurement methodology and mass definitions in the low-mass bins.
Mirroring the trend observed in the dynamical masses within RHI, the median enclosed dark matter masses within RHI for the ALFALFA sample are systematically lower than those of the TNG100-mock across all five stellar mass bins, with the difference minimal in the lowest mass bin and increasing toward higher bins. This is supported by MWU p-values < 0.01 in every mass bin, while Cliff’s δ is consistently negative, with magnitudes increasing from 0.13 to 0.28 toward higher stellar mass. This increasing offset toward higher stellar masses in the median is caused by a tail of galaxies with comparatively low dark matter content, which becomes more prominent at higher stellar masses. This effect is particularly evident in the highest mass bin (M* > 1011 M⊙), where ∼32% of ALFALFA galaxies have MDM(< RHI) < 1011.5 M⊙, compared to only 17% of the TNG100-mock galaxies. The p-values of the KS test are below 0.01 in all mass bins, confirming that the ALFALFA and TNG100-mock samples follow statistically distinct distributions. We note that although the comparison between TNG100-mock and TNG100-true shows that the low-mass bins are affected by methodological biases, the comparison between ALFALFA and TNG100-mock in this regime is still informative, because both datasets are processed with the same observational method. The interpretation in this mass range, however, must account for the fact that the differences cannot be attributed purely to physical origins.
We further quantify the difference between these histograms and present them as a relation between the stellar mass and the dark matter halo mass within RHI, as shown in Figure 6. The upper panel shows the median and 1σ scatter (16th to 84th percentile) for each mass bin. Alongside the ALFALFA and the TNG100 sample, we include the enclosed dark matter mass within RHI of the counterpart in the TNG100-dark simulation (denoted as TNG100-dark). We also include a ‘dark matter’ mass within RHI that is derived by removing the true baryonic mass of the TNG100-true from the mock dynamical mass of the TNG100-mock (denoted as TNG100-mock*). The lower panel shows the relative change of the median values compared to that of the TNG100-dark for each mass bin in the same colour scheme and line style.
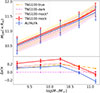 |
Fig. 6. Relation between the stellar mass and the enclosed dark matter mass within RHI. The upper panel shows the median and the 1σ scatter (16th to 84th percentile) for the ALFALFA sample galaxies (blue solid), the mock observations (TNG100-mock, red solid) and the true value (TNG100-true, orange dash-dotted) of the TNG100 sample, the counterpart of the sample from the TNG100-dark simulation (pink dashed), and a ‘dark matter’ mass derived by removing the true baryonic mass of the TNG100 from the mock dynamical mass of the TNG100-mock (TNG100-mock*, red dotted). The lower panel presents the relative change of the median values compared to that of the TNG100-dark line in the same colour scheme and line style. We also indicate the errors for the median values of the ALFALFA sample and TNG100-mock with their corresponding error bars. |
Across five mass bins, the dark matter masses within RHI of the TNG100-true are about 10−20% higher than those of the TNG100-dark. This suggests an overall halo contraction phenomenon in the TNG100 simulation, as reported in Lovell et al. (2018).
The TNG100-mock exhibits higher enclosed dark matter masses within RHI than the TNG100-true in the three low-mass bins, while being generally consistent with the TNG100-true in the two high-mass bins, as shown by the statistical results in the previous section. In the highest mass bin (M* ≥ 1011 M⊙), the enclosed dark matter mass within RHI of the TNG100-mock is slightly lower (∼13%) than that of the TNG100-true. To investigate the origin of these discrepancies, we introduce the TNG100-mock*, defined by subtracting the true baryonic mass of the TNG100-true (summing all stellar and gas particles) from the measured dynamical mass of the TNG100-mock obtained using the observational method. In the low-mass bins, the TNG100-mock* closely matches the TNG100-true values and lies below the TNG100-mock, indicating that the discrepancies in these bins primarily arise from methodological biases in baryonic mass estimation. Our observationally motivated approach (Section 2, Eq. 8) includes stellar mass and cold gas phases (atomic and molecular gas) but omits hot gas. However, TNG100 galaxies, especially low-mass, gas-rich ones, contain a non-negligible fraction of hot gas, which is observationally inaccessible and thus not accounted for in our gas mass estimates (Nelson et al. 2018; Zinger et al. 2020). In the high-mass bins, the overall gas fraction decreases with increasing stellar mass, reducing the difference between TNG100-mock* and TNG100-mock. Meanwhile, a modest discrepancy between TNG100-mock* and TNG100-true persists and becomes slightly more pronounced toward higher stellar mass. This arises from a slight underestimation of the dynamical mass within RHI, which is calculated from the H I line width V85 and the disc inclination i. Factors such as misalignment between the H I and stellar discs, underestimation of the intrinsic flattening q0 of the stellar disc, or outliers can lead to a slightly lower circular velocity Vc, and hence Mdyn(< RHI). While this effect exists at all masses, the limited sample size in the highest-mass bin (132 galaxies, less than 25% of other bins) makes the average results more sensitive to individual measurement uncertainties.
The ALFALFA sample exhibits systematically lower enclosed dark matter masses within RHI than the TNG100-mock, but the physical interpretation differs across the mass range. In the low-mass bins, observational measurements may suffer from unaccounted hot gas components, leaving open whether the enclosed dark matter masses in ALFALFA are closer to those in TNG100-true (or TNG100-mock*) or even as low as in TNG100-dark. At higher stellar masses, the gas fraction decreases such that the differences are no longer mainly driven by potential biases from the unaccounted hot gas. In the highest mass bin (M* ≥ 1011 M⊙), the total gas-to-dark matter ratio within RHI in TNG100 is only ∼0.05 (similar to the cold gas fraction in ALFALFA), indicating that gas has a negligible impact on the enclosed mass budget. In this bin, the enclosed dark matter mass within RHI in ALFALFA is about 19% lower than in the TNG100-mock and 23% lower than in the TNG100-dark. Since both ALFALFA and TNG100-mock are subject to the same dynamical mass estimation bias, this discrepancy reflects a robustly lower enclosed dark matter mass in ALFALFA compared to TNG100, which would only become more pronounced if additional unaccounted gas were present in the ALFALFA.
We find that in the highest mass bin in the ALFALFA sample, all of the 132 galaxies with stellar mass exceeding 1011 M⊙ are classified as late-type based on our visual inspection of their images, with RHI (i.e. the radii enclosing the dark matter traced by H I) ranging from 20 to 70 kpc. The difference we found between ALFALFA and TNG100 galaxies at this mass range can hardly be explained solely by baryonic feedback processes. Previous studies have shown that supernova-driven feedback can form dark matter cores of a few kpc in low-mass galaxies (e.g. Pontzen & Governato 2012; Freundlich et al. 2020), and AGN-driven outflows are able to generate cores up to about 10 kpc in intermediate-mass galaxies (e.g. Martizzi et al. 2013; Li et al. 2023). However, forming cores as large as 20−70 kpc in galaxies with M* > 1011 M⊙ remains challenging, as it would require substantially more efficient energy transfer to the dark matter halo than currently demonstrated. At this high-mass end, the dark matter mass within RHI is an indicator of the total dark matter halo mass, thus the lack of galaxies with low enclosed dark matter mass within RHI in the TNG100 simulation highlights a deficiency of massive galaxies residing in small dark matter haloes in the TNG100 simulation: In the ALFALFA sample, 32% of massive late-type galaxies reside in smaller dark matter halos (below 1011.5 M⊙ within RHI), whereas in the TNG100 simulation, this figure is 17%.
5. Discussion
In our study, we find that although a larger fraction of massive late-type galaxies (1011 M⊙ ≤ M* < 1011.4 M⊙) reside in relatively smaller dark matter haloes compared to the TNG100 simulation, the majority still have halo masses consistent with those predicted by TNG100. This implies that, overall, the SHMR of these galaxies agrees reasonably well with the TNG100 relation. At first sight, this appears to be at odds with the compilation of Wang & Peng (2025), which compares the SHMRs of late-type and early-type galaxies across a range of observations and simulations. In their sample, more than 95% of the 22 late-type galaxies in this stellar mass range-measured from H I rotation curves (Posti et al. 2019; Di Teodoro et al. 2023) fall below the 1σ scatter of the IllustrisTNG-predicted SHMR, which does not differentiate between morphological types.
To clarify the observed discrepancy, we compute the enclosed mass within RHI for 15 late-type galaxies from Posti et al. (2019) and seven late-type galaxies from Di Teodoro et al. (2023) within this stellar mass range. These are plotted alongside the measurements of the ALFALFA sample and the true values of the TNG100 sample, as illustrated in Figure 7. We find that only 73% of the 22 galaxies from Posti et al. (2019) and Di Teodoro et al. (2023) fall below the 1σ scatter of the TNG100-true, indicating a systematic offset less pronounced than the 1σ discrepancy reported by Wang & Peng (2025). Nevertheless, the distribution of these galaxies in the literature is covered by the ALFALFA sample, which largely overlaps with the TNG100-true.
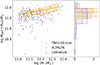 |
Fig. 7. Left: relation between the stellar mass and the enclosed dark matter mass within RHI within the stellar mass range 1011 M⊙ ≤ M* < 1011.4 M⊙. We show the ALFALFA sample in blue, the TNG100-true in orange, and in pink the combined literature late-type galaxies from Posti et al. (2019) and Di Teodoro et al. (2023). The orange solid and dashed lines indicates the median and the 1σ scatter (16th to 84th percentile) for TNG100-true. Right: normalized distributions of the enclosed dark matter mass within RHI for the same samples, plotted in the same colour scheme. |
Given the small size of the samples of Posti et al. (2019) and Di Teodoro et al. (2023), sampling fluctuations can partly account for the apparent offset. We perform a bootstrap test by randomly drawing 22 galaxies from the ALFALFA sample 10 000 times and computing the median of each draw. The median of the literature sample falls around the 4th percentile of the bootstrap distribution (p ≈ 0.04), consistent with being within 2σ. This suggests that the lower dark matter masses reported by Posti et al. (2019) and Di Teodoro et al. (2023) could plausibly arise from sampling variance, although a mild intrinsic offset cannot be ruled out. In addition, systematic differences in the assumed halo density profiles may contribute to the lower observationally inferred M200. Observational estimates typically extrapolate from the inner regions assuming NFW (γ = 1) or cored (γ ∼ 0) profiles, which are shallower than the inner density slopes of simulated halos (γ ∼ 1.6 − 1.8; Lovell et al. 2018). A shallower profile implies a more slowly increasing cumulative mass with radius, leading to a lower extrapolated M200 for a given enclosed mass within RHI. Therefore, part of the offset between the literature galaxies and the TNG100 relation may reflect this intrinsic difference in halo structure, in addition to sample variance.
We estimate the dark matter halo mass M200 by extrapolating the dark matter mass within RHI using an NFW profile (Navarro et al. 1996, 1997), along with the halo mass-concentration relation proposed in Dutton & Macciò (2014), applicable to both the ALFALFA sample and mock observations of TNG100 galaxies. M200 is defined as the enclosed mass within the virial radius r200, where the average density within r200 is 200 times the critical density (ρcrit = 1.37 × 10⁻⁷ M⊙/pc3, adopting a Hubble constant H0 = 70 km/s/Mpc); and the concentration is defined as the ratio of the virial radius r200 and the scale radius of the NFW profile. Figure 8 illustrates the relation between stellar mass and the extrapolated halo mass. We show the ALFALFA sample from this work as well as the true values and mock-based results of TNG100, with the SHMR for early-type galaxies and late-type galaxies as reported by Mandelbaum et al. (2016) as a reference. We note that the consistency between TN100-mock and TNG100-true confirms that the TNG100 galaxies follow the halo mass-concentration relation as described by Dutton & Macciò (2014). By employing the same assumptions for estimating dark matter halo mass, the M* − M200 relation for both ALFALFA and TNG100-mock galaxies reflects the M* − MDM(< RHI) relation illustrated in Figure 6. In the mass range below 1011 M⊙, the ALFALFA and TNG100 samples are 1σ compatible with the SHMR for late-type galaxies found by Mandelbaum et al. (2016), whereas in the mass range above 1011 M⊙, the SHMR of late-type galaxies reported by Mandelbaum et al. (2016) only aligns 1σ with the TNG100 galaxies and is slightly higher than the ALFALFA sample.
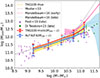 |
Fig. 8. Relation between the stellar mass and the extrapolated dark matter halo mass. We show the median and the 1σ scatter (16th to 84th percentile) for ALFALFA sample galaxies (blue solid), TNG100-mock (red solid), and TNG100-true (orange dashed and shadow). The estimated dark matter halo mass M200 is derived from the dark matter mass within RHI, using an NFW profile and the halo mass-concentration relation from Dutton & Macciò (2014). Late-type galaxies from Posti et al. (2019) and Di Teodoro et al. (2023) are shown with purple and green triangles, respectively. The SHMRs for early-type (pink dashed and shadow) and late-type (light blue dashed and shadow) galaxies from Mandelbaum et al. (2016) are also displayed. |
6. Summary
In this study, we evaluated the dark matter content in a sample of 2453 galaxies from the ALFALFA survey. We constructed a one-to-one sample matched in the M* − RHI plane from the TNG100 simulation. We performed mock images and H I observations under the conditions of their counterparts, enabling us to measure their dark matter content through the observational method. The main results are as follows:
-
Comparing the true values of the TNG100 sample with results derived from mock observations, we demonstrate that the method introduces minimal bias in the dynamical mass measurements, within about 5% across most of the stellar mass range and up to 12.5% at the highest masses (M* ≥ 1011 M⊙). Statistical tests confirm that these offsets are not significant: the MWU p-values exceed 0.01 and the absolute values of Cliff’s δ are below 0.11 in all bins, indicating that the method provides reliable dynamical mass estimates.
-
The median dark matter content of the ALFALFA sample is lower than that derived from the mock observations of the TNG100 simulation across all stellar mass bins. In each bin, this offset arises from a tail of galaxies with comparatively low dark matter content, and the prominence of this tail increases toward higher stellar masses. Statistical tests corroborate this trend: the MWU p-values are < 0.01 in each mass bin, while Cliff’s δ is consistently negative, reflecting the systematically lower dark matter content in ALFALFA relative to the TNG100-mock. At the low-mass end (M* < 109.5 M⊙), the difference is modest, with broadly consistent distributions between the two samples. At the high-mass end (M* > 1011 M⊙), the median dark matter content in ALFALFA is about 23% lower than in the TNG100-dark simulation. Within this bin, about 32% of ALFALFA galaxies have dark matter halo masses below 1011.5 M⊙ within RHI, compared to only 17% in the TNG100 mock galaxies. Considering that galaxies in the highest mass bin of the ALFALFA sample are late-type with the enclosed radii ranging from 20 kpc to 70 kpc, our findings suggest that a higher portion of these massive late-type galaxies reside in smaller dark matter haloes compared to TNG100 galaxies.
Data availability
Measurements for the ALFALFA parent sample are provided in the table alfa4844.txt, while the true values and mock results for the TNG100 sample are provided in tng2453.txt. Both tables are available at the CDS via https://cdsarc.cds.unistra.fr/viz-bin/cat/J/A+A/706/A64
Acknowledgments
We thank the anonymous referee for the careful reading of the manuscript and for the constructive and helpful comments. MY acknowledges the support of the National Natural Science Foundation of China, Young Scientists Fund project, number 12303014. LZ acknowledges the support of the CAS Project for Young Scientists in Basic Research under grant No. YSBR-062 and National Key R&D Program of China No. 2022YFF0503403. MY and LZ acknowledge the hospitality of the International Centre of Supernovae (ICESUN), Yunnan Key Laboratory at Yunnan Observatories Chinese Academy of Sciences. N.K.Y. is supported by the project funded by China Postdoctoral Science Foundation No. 2022M723175 and GZB20230766. ZZ is supported by National Key R&D Program of China No. 2023YFC2206403 and 2024YFA1611602. ZZ is also supported by NSFC grants No. 12588202, 12373012, 12041302 and CMS-CSST-2025-A08.
References
- Ahumada, R., Allende Prieto, C., Almeida, A., et al. 2020, ApJS, 249, 3 [NASA ADS] [CrossRef] [Google Scholar]
- Alabi, A. B., Forbes, D. A., Romanowsky, A. J., et al. 2016, MNRAS, 460, 3838 [Google Scholar]
- Alabi, A. B., Forbes, D. A., Romanowsky, A. J., et al. 2017, MNRAS, 468, 3949 [Google Scholar]
- An, K. 1933, Giorn Dell’inst Ital Degli Att, 4, 89 [Google Scholar]
- Behroozi, P. S., Conroy, C., & Wechsler, R. H. 2010, ApJ, 717, 379 [Google Scholar]
- Behroozi, P., Wechsler, R. H., Hearin, A. P., & Conroy, C. 2019, MNRAS, 488, 3143 [NASA ADS] [CrossRef] [Google Scholar]
- Bilicki, M., Dvornik, A., Hoekstra, H., et al. 2021, A&A, 653, A82 [NASA ADS] [CrossRef] [EDP Sciences] [Google Scholar]
- Biswas, P., Kalinova, V., Roy, N., Patra, N. N., & Tyulneva, N. 2023, MNRAS, 524, 6213 [Google Scholar]
- Blanton, M. R., Kazin, E., Muna, D., Weaver, B. A., & Price-Whelan, A. 2011, AJ, 142, 31 [NASA ADS] [CrossRef] [Google Scholar]
- Boardman, N. F., Weijmans, A.-M., van den Bosch, R., et al. 2016, MNRAS, 460, 3029 [Google Scholar]
- Broeils, A. H., & Rhee, M. H. 1997, A&A, 324, 877 [NASA ADS] [Google Scholar]
- Cai, R., Zhu, L., Shen, S., et al. 2025, A&A, 695, A177 [NASA ADS] [CrossRef] [EDP Sciences] [Google Scholar]
- Cappellari, M., Scott, N., Alatalo, K., et al. 2013, MNRAS, 432, 1709 [Google Scholar]
- Casertano, S. P. R., & Shostak, G. S. 1980, A&A, 81, 371 [Google Scholar]
- Cliff, N. 1993, Psychological Bulletin, 114, 494 [Google Scholar]
- Cliff, N. 1996, Multivariate Behavioral Research, 31, 331 [Google Scholar]
- Comerón, S., Trujillo, I., Cappellari, M., et al. 2023, A&A, 675, A143 [NASA ADS] [CrossRef] [EDP Sciences] [Google Scholar]
- Conroy, C., Prada, F., Newman, J. A., et al. 2007, ApJ, 654, 153 [Google Scholar]
- Cooke, L. H., Levy, R. C., Bolatto, A. D., et al. 2022, MNRAS, 512, 1012 [Google Scholar]
- Correa, C. A., & Schaye, J. 2020, MNRAS, 499, 3578 [Google Scholar]
- Cui, W., Davé, R., Peacock, J. A., Anglés-Alcázar, D., & Yang, X. 2021, Nat. Astron., 5, 1069 [NASA ADS] [CrossRef] [Google Scholar]
- de Blok, W. J. G., Walter, F., Brinks, E., et al. 2008, AJ, 136, 2648 [NASA ADS] [CrossRef] [Google Scholar]
- de Isídio, N. G., Menéndez-Delmestre, K., Gonçalves, T. S., et al. 2024, ApJ, 971, 69 [Google Scholar]
- Di Teodoro, E. M., Posti, L., Fall, S. M., et al. 2023, MNRAS, 518, 6340 [Google Scholar]
- Diemer, B., Stevens, A. R. H., Forbes, J. C., et al. 2018, ApJS, 238, 33 [NASA ADS] [CrossRef] [Google Scholar]
- Dumont, A., Seth, A. C., Strader, J., et al. 2024, A&A, 685, A132 [NASA ADS] [CrossRef] [EDP Sciences] [Google Scholar]
- Dutton, A. A., & Macciò, A. V. 2014, MNRAS, 441, 3359 [Google Scholar]
- Erfanianfar, G., Finoguenov, A., Furnell, K., et al. 2019, A&A, 631, A175 [NASA ADS] [CrossRef] [EDP Sciences] [Google Scholar]
- Forestell, A. D., & Gebhardt, K. 2010, ApJ, 716, 370 [Google Scholar]
- Freundlich, J., Dekel, A., Jiang, F., et al. 2020, MNRAS, 491, 4523 [NASA ADS] [CrossRef] [Google Scholar]
- Gnedin, N. Y., & Kravtsov, A. V. 2011, ApJ, 728, 88 [NASA ADS] [CrossRef] [Google Scholar]
- Hagedorn, B., Cicone, C., Sarzi, M., et al. 2024, A&A, 687, A244 [NASA ADS] [CrossRef] [EDP Sciences] [Google Scholar]
- Harris, G. L. H., Babyk, I. V., Harris, W. E., & McNamara, B. R. 2019, ApJ, 887, 259 [NASA ADS] [CrossRef] [Google Scholar]
- Harris, W. E., Remus, R.-S., Harris, G. L. H., & Babyk, I. V. 2020, ApJ, 905, 28 [CrossRef] [Google Scholar]
- Haynes, M. P., Giovanelli, R., Martin, A. M., et al. 2011, AJ, 142, 170 [Google Scholar]
- Haynes, M. P., Giovanelli, R., Kent, B. R., et al. 2018, ApJ, 861, 49 [Google Scholar]
- Huang, S., Leauthaud, A., Hearin, A., et al. 2020, MNRAS, 492, 3685 [NASA ADS] [CrossRef] [Google Scholar]
- Kamada, A., Kaplinghat, M., Pace, A. B., & Yu, H.-B. 2017, Phys. Rev. Lett., 119, 111102 [Google Scholar]
- Kaplinghat, M., Tulin, S., & Yu, H.-B. 2016, Phys. Rev. Lett., 116, 041302 [NASA ADS] [CrossRef] [Google Scholar]
- Koribalski, B. S., Wang, J., Kamphuis, P., et al. 2018, MNRAS, 478, 1611 [NASA ADS] [CrossRef] [Google Scholar]
- Kravtsov, A. V., Vikhlinin, A. A., & Meshcheryakov, A. V. 2018, Astron. Lett., 44, 8 [Google Scholar]
- Lagos, C. D. P., Crain, R. A., Schaye, J., et al. 2015, MNRAS, 452, 3815 [NASA ADS] [CrossRef] [Google Scholar]
- Li, P., Lelli, F., McGaugh, S., & Schombert, J. 2020, ApJS, 247, 31 [Google Scholar]
- Li, Z., Dekel, A., Mandelker, N., Freundlich, J., & François, T. L. 2023, MNRAS, 518, 5356 [Google Scholar]
- Lovell, M. R., Pillepich, A., Genel, S., et al. 2018, MNRAS, 481, 1950 [Google Scholar]
- Mancera Piña, P. E., Fraternali, F., Oosterloo, T., et al. 2022, MNRAS, 514, 3329 [CrossRef] [Google Scholar]
- Mandelbaum, R., Seljak, U., Kauffmann, G., Hirata, C. M., & Brinkmann, J. 2006, MNRAS, 368, 715 [NASA ADS] [CrossRef] [Google Scholar]
- Mandelbaum, R., Wang, W., Zu, Y., et al. 2016, MNRAS, 457, 3200 [Google Scholar]
- Mann, H. B., & Whitney, D. R. 1947, Ann. Math. Stat., 18, 50 [Google Scholar]
- Martizzi, D., Teyssier, R., & Moore, B. 2013, MNRAS, 432, 1947 [NASA ADS] [CrossRef] [Google Scholar]
- More, S., van den Bosch, F. C., Cacciato, M., et al. 2011, MNRAS, 410, 210 [Google Scholar]
- Moster, B. P., Somerville, R. S., Maulbetsch, C., et al. 2010, ApJ, 710, 903 [Google Scholar]
- Navarro, J. F., Frenk, C. S., & White, S. D. M. 1996, ApJ, 462, 563 [Google Scholar]
- Navarro, J. F., Frenk, C. S., & White, S. D. M. 1997, ApJ, 490, 493 [Google Scholar]
- Nelson, D., Kauffmann, G., Pillepich, A., et al. 2018, MNRAS, 477, 450 [NASA ADS] [CrossRef] [Google Scholar]
- Nibauer, J., Bonaca, A., & Johnston, K. V. 2023, ApJ, 954, 195 [NASA ADS] [CrossRef] [Google Scholar]
- Oh, S.-H., de Blok, W. J. G., Brinks, E., Walter, F., & Kennicutt, R. C. 2011, AJ, 141, 193 [NASA ADS] [CrossRef] [Google Scholar]
- Pearson, S., Price-Whelan, A. M., Hogg, D. W., et al. 2022, ApJ, 941, 19 [NASA ADS] [CrossRef] [Google Scholar]
- Pontzen, A., & Governato, F. 2012, MNRAS, 421, 3464 [NASA ADS] [CrossRef] [Google Scholar]
- Posti, L., & Fall, S. M. 2021, A&A, 649, A119 [NASA ADS] [CrossRef] [EDP Sciences] [Google Scholar]
- Posti, L., Fraternali, F., & Marasco, A. 2019, A&A, 626, A56 [NASA ADS] [CrossRef] [EDP Sciences] [Google Scholar]
- Reddick, R. M., Wechsler, R. H., Tinker, J. L., & Behroozi, P. S. 2013, ApJ, 771, 30 [Google Scholar]
- Rodríguez-Puebla, A., Avila-Reese, V., Yang, X., et al. 2015, ApJ, 799, 130 [Google Scholar]
- Salim, S., Lee, J. C., Janowiecki, S., et al. 2016, ApJS, 227, 2 [NASA ADS] [CrossRef] [Google Scholar]
- Salim, S., Boquien, M., & Lee, J. C. 2018, ApJ, 859, 11 [Google Scholar]
- Sánchez-Janssen, R., Méndez-Abreu, J., & Aguerri, J. A. L. 2010, MNRAS, 406, L65 [NASA ADS] [Google Scholar]
- Santucci, G., Brough, S., van de Sande, J., et al. 2022, ApJ, 930, 153 [NASA ADS] [CrossRef] [Google Scholar]
- Smirnov, N. V. 1939, Bulletin Moscow University, 2, 3 [Google Scholar]
- Springel, V., & Hernquist, L. 2003, MNRAS, 339, 289 [Google Scholar]
- Springel, V., Wang, J., Vogelsberger, M., et al. 2008, MNRAS, 391, 1685 [Google Scholar]
- Stevens, A. R. H., Diemer, B., Lagos, C. D. P., et al. 2019, MNRAS, 490, 96 [Google Scholar]
- Tinker, J. L., Brownstein, J. R., Guo, H., et al. 2017, ApJ, 839, 121 [Google Scholar]
- Wang, K., & Peng, Y. 2025, ApJ, 980, 233 [Google Scholar]
- Wang, J., Fu, J., Aumer, M., et al. 2014, MNRAS, 441, 2159 [Google Scholar]
- Wang, J., Koribalski, B. S., Serra, P., et al. 2016, MNRAS, 460, 2143 [Google Scholar]
- Wilcoxon, F. 1945, Biometrics Bulletin, 1, 80 [CrossRef] [Google Scholar]
- Wojtak, R., & Mamon, G. A. 2013, MNRAS, 428, 2407 [Google Scholar]
- Yang, X., Mo, H. J., & van den Bosch, F. C. 2009, ApJ, 695, 900 [Google Scholar]
- Yang, M., Zhu, L., Weijmans, A.-M., et al. 2020, MNRAS, 491, 4221 [NASA ADS] [CrossRef] [Google Scholar]
- Yang, M., Zhu, L., Lei, Y., et al. 2024, MNRAS, 528, 5295 [Google Scholar]
- Yu, N., Ho, L. C., & Wang, J. 2020, ApJ, 898, 102 [NASA ADS] [CrossRef] [Google Scholar]
- Yu, N., Ho, L. C., Wang, J., & Li, H. 2022, ApJS, 261, 21 [NASA ADS] [CrossRef] [Google Scholar]
- Zheng, Z., Coil, A. L., & Zehavi, I. 2007, ApJ, 667, 760 [Google Scholar]
- Zhu, K., Lu, S., Cappellari, M., et al. 2023, MNRAS, 522, 6326 [NASA ADS] [CrossRef] [Google Scholar]
- Zinger, E., Pillepich, A., Nelson, D., et al. 2020, MNRAS, 499, 768 [CrossRef] [Google Scholar]
- Zu, Y., & Mandelbaum, R. 2015, MNRAS, 454, 1161 [Google Scholar]
Appendix A: Method validation in TNG100
In this section, we present the validation results of our observational method. We selected galaxies from the TNG100 simulations and created mock H I observations for them. The mock H I-integrated spectra were created using the procedure described in Section 3. Each galaxy was positioned at a distance of 100 Mpc and was observed under conditions similar to those of the Green Bank Radio Telescope, which features a beam size of 540 arcsec and a channel width of 1.4 km/s.
Following the method described in Section 2, we first measured the corrected line width indicator V85, c. We show its relationship to the true rotational velocity Vrot in Figure A.1. The H I galaxies are divided into four categories by their predicted inclination measured from the observational axis q. We fit a linear scaling relation between V85, c and Vrot for each category and compare it with the scaling relation reported in Yu et al. (2022). The findings indicate that only edge-on galaxies in the TNG100 adhere to this observed scaling relation.
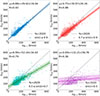 |
Fig. A.1. The relationship between rotational and corrected line width indicators for galaxies with different predicted inclinations. In each panel, the solid line and the corresponding shaded area represent the best-fitting line and its 1σ scatter, and the grey dashed line represents the relationship obtained by Yu et al. (2020). |
We then calculated the circular velocity using the scaling relation reported in Yu et al. (2022), and from this we derived the dynamical mass. We show the comparison of this derived dynamical mass with the true dynamical mass in Figure A.2. We establish a linear scaling relationship for the four categories of different inclinations. The findings indicate that this method can accurately recover the dynamical mass of galaxies without significant bias within the specified stellar mass range, provided that these galaxies have an inclination of sin(i)≥0.7 (i ≳ 45°). Therefore, we finally selected galaxies with sin(i)≥0.7 to form the parent sample of TNG100.
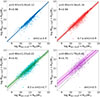 |
Fig. A.2. The relationship between the true total masses and measured dynamical masses from mock observations for the TNG100 parent sample. In each panel, the solid line and the corresponding shaded area represent the best-fitting line and its 1σ scatter, and the grey dashed line indicates the one-to-one line. |
Appendix B: Spectra of ALFALFA parent sample
We show the H I-integrated spectra of 4844 galaxies in the ALFALFA parent sample, which are divided into 20 equal-number bins by W50, as shown in Figure B.1. The spectra are normalised by their total flux to highlight the characteristic line shapes. A prominent feature emerging from these stacked spectra is the prevalence of the double-horned profile, a typical signature of rotation-dominated H I discs. This demonstrates the consistency of our sample selection criteria, which preferentially include galaxies with extended, regularly rotating gas discs.
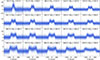 |
Fig. B.1. H I-integrated spectra of galaxies in the ALFALFA parent sample, divided into 20 equal-number bins by W50 (km/s). In each panel, the flux is normalised by the total integrated flux, and the corresponding W50 range is indicated. |
Appendix C: Definition of H I mass in simulations
In observations, the total H I mass is measured through the telescope aperture, which typically extends well beyond the ‘true’ H I radius, defined as the radius where the H I column density drops to 1 M⊙ pc−2. As a result, the observed MHI generally includes gas at much lower surface densities beyond this ‘true’ H I radius.
In simulations, simply taking the H I mass of the entire subhalo leads to a systematic offset in the MHI − RHI relation compared to the empirical relation of Wang et al. (2016), whereas restricting the H I mass strictly within this ‘true’ H I radius underestimates the observationally accessible H I content, as it ignores the extended low-column-density component.
We tried several alternative definitions. We find that adopting the H I mass enclosed within 2.2 times the ‘true’ H I radius provides a good compromise: the resulting MHI − RHI relation for TNG100 galaxies closely follows the empirical relation of Wang et al. (2016) with only small scatter, as shown in Figure C.1. We therefore adopted this definition as the total H I mass, and inferred the observed-style RHI from it.
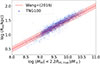 |
Fig. C.1. The correlation between the ‘true’ H I radius and the H I mass within 2.2 times the ‘true’ H I radius. The TNG100 galaxies are displayed in blue dots, and the calibration of Wang et al. (2016) is shown in red. |
All Tables
Pairwise statistical tests of the enclosed dynamical masses within RHI across stellar mass bins.
Pairwise statistical tests of the enclosed dark matter masses within RHI across stellar mass bins.
All Figures
|
Fig. 1. Left: the ALFALFA matched sample galaxies (blue) and the TNG100 matched sample (red) on the log(M*)−log(RHI) plane. We plot the ALFALFA parent sample (light blue) and TNG100 H I galaxies (orange) in the background. Right: RHI distribution for the aforementioned samples plotted in the same colour scheme. |
| In the text | |
|
Fig. 2. Colour-magnitude diagram for the sample galaxies. The ALFALFA sample is displayed with varying colours representing density and consists primarily of star-forming galaxies. Additionally, the NASA-Sloan Atlas catalogue is shown in the background with the contour lines (Blanton et al. 2011). |
| In the text | |
|
Fig. 3. r-band images and H I-integrated spectra for an ALFALFA galaxy AGC008220 (top) and a mock galaxy TNG100-445271 (bottom) from the TNG100 simulation. The H I spectra panels (right) display the corresponding stellar mass, H I mass, and RHI values for each galaxy. |
| In the text | |
|
Fig. 4. Histograms of the enclosed dynamical mass within RHI for the ALFALFA sample and the TNG100 sample in five mass bins. The measurements for the ALFALFA sample are shown in blue, the true values of the TNG100 sample (TNG100-true) are plotted in orange, and the results obtained from the mock observations of the TNG100 sample (TNG100-mock) are shown in red. Median values for each dataset are indicated by a vertical dashed line matching the colour of the sample. |
| In the text | |
|
Fig. 5. Histograms of the enclosed dark matter mass within RHI for the ALFALFA sample and the TNG100 sample in five mass bins. The measurements for the ALFALFA sample are shown in blue, the true values of the TNG100 sample (TNG100-true) are plotted in orange, and the results obtained from the mock observations of TNG100 sample (TNG100-mock) are shown in red. Median values for each dataset are indicated by a vertical dashed line matching the colour of the sample. |
| In the text | |
|
Fig. 6. Relation between the stellar mass and the enclosed dark matter mass within RHI. The upper panel shows the median and the 1σ scatter (16th to 84th percentile) for the ALFALFA sample galaxies (blue solid), the mock observations (TNG100-mock, red solid) and the true value (TNG100-true, orange dash-dotted) of the TNG100 sample, the counterpart of the sample from the TNG100-dark simulation (pink dashed), and a ‘dark matter’ mass derived by removing the true baryonic mass of the TNG100 from the mock dynamical mass of the TNG100-mock (TNG100-mock*, red dotted). The lower panel presents the relative change of the median values compared to that of the TNG100-dark line in the same colour scheme and line style. We also indicate the errors for the median values of the ALFALFA sample and TNG100-mock with their corresponding error bars. |
| In the text | |
|
Fig. 7. Left: relation between the stellar mass and the enclosed dark matter mass within RHI within the stellar mass range 1011 M⊙ ≤ M* < 1011.4 M⊙. We show the ALFALFA sample in blue, the TNG100-true in orange, and in pink the combined literature late-type galaxies from Posti et al. (2019) and Di Teodoro et al. (2023). The orange solid and dashed lines indicates the median and the 1σ scatter (16th to 84th percentile) for TNG100-true. Right: normalized distributions of the enclosed dark matter mass within RHI for the same samples, plotted in the same colour scheme. |
| In the text | |
|
Fig. 8. Relation between the stellar mass and the extrapolated dark matter halo mass. We show the median and the 1σ scatter (16th to 84th percentile) for ALFALFA sample galaxies (blue solid), TNG100-mock (red solid), and TNG100-true (orange dashed and shadow). The estimated dark matter halo mass M200 is derived from the dark matter mass within RHI, using an NFW profile and the halo mass-concentration relation from Dutton & Macciò (2014). Late-type galaxies from Posti et al. (2019) and Di Teodoro et al. (2023) are shown with purple and green triangles, respectively. The SHMRs for early-type (pink dashed and shadow) and late-type (light blue dashed and shadow) galaxies from Mandelbaum et al. (2016) are also displayed. |
| In the text | |
|
Fig. A.1. The relationship between rotational and corrected line width indicators for galaxies with different predicted inclinations. In each panel, the solid line and the corresponding shaded area represent the best-fitting line and its 1σ scatter, and the grey dashed line represents the relationship obtained by Yu et al. (2020). |
| In the text | |
|
Fig. A.2. The relationship between the true total masses and measured dynamical masses from mock observations for the TNG100 parent sample. In each panel, the solid line and the corresponding shaded area represent the best-fitting line and its 1σ scatter, and the grey dashed line indicates the one-to-one line. |
| In the text | |
|
Fig. B.1. H I-integrated spectra of galaxies in the ALFALFA parent sample, divided into 20 equal-number bins by W50 (km/s). In each panel, the flux is normalised by the total integrated flux, and the corresponding W50 range is indicated. |
| In the text | |
|
Fig. C.1. The correlation between the ‘true’ H I radius and the H I mass within 2.2 times the ‘true’ H I radius. The TNG100 galaxies are displayed in blue dots, and the calibration of Wang et al. (2016) is shown in red. |
| In the text | |
Current usage metrics show cumulative count of Article Views (full-text article views including HTML views, PDF and ePub downloads, according to the available data) and Abstracts Views on Vision4Press platform.
Data correspond to usage on the plateform after 2015. The current usage metrics is available 48-96 hours after online publication and is updated daily on week days.
Initial download of the metrics may take a while.