Fig. 5.
Download original image
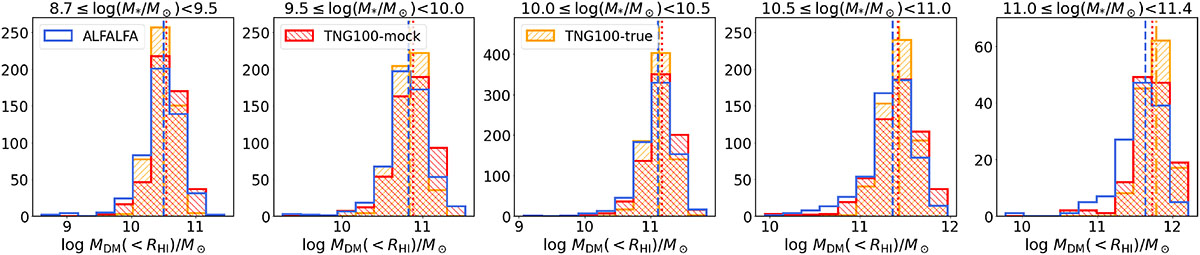
Histograms of the enclosed dark matter mass within RHI for the ALFALFA sample and the TNG100 sample in five mass bins. The measurements for the ALFALFA sample are shown in blue, the true values of the TNG100 sample (TNG100-true) are plotted in orange, and the results obtained from the mock observations of TNG100 sample (TNG100-mock) are shown in red. Median values for each dataset are indicated by a vertical dashed line matching the colour of the sample.
Current usage metrics show cumulative count of Article Views (full-text article views including HTML views, PDF and ePub downloads, according to the available data) and Abstracts Views on Vision4Press platform.
Data correspond to usage on the plateform after 2015. The current usage metrics is available 48-96 hours after online publication and is updated daily on week days.
Initial download of the metrics may take a while.