Fig. 7.
Download original image
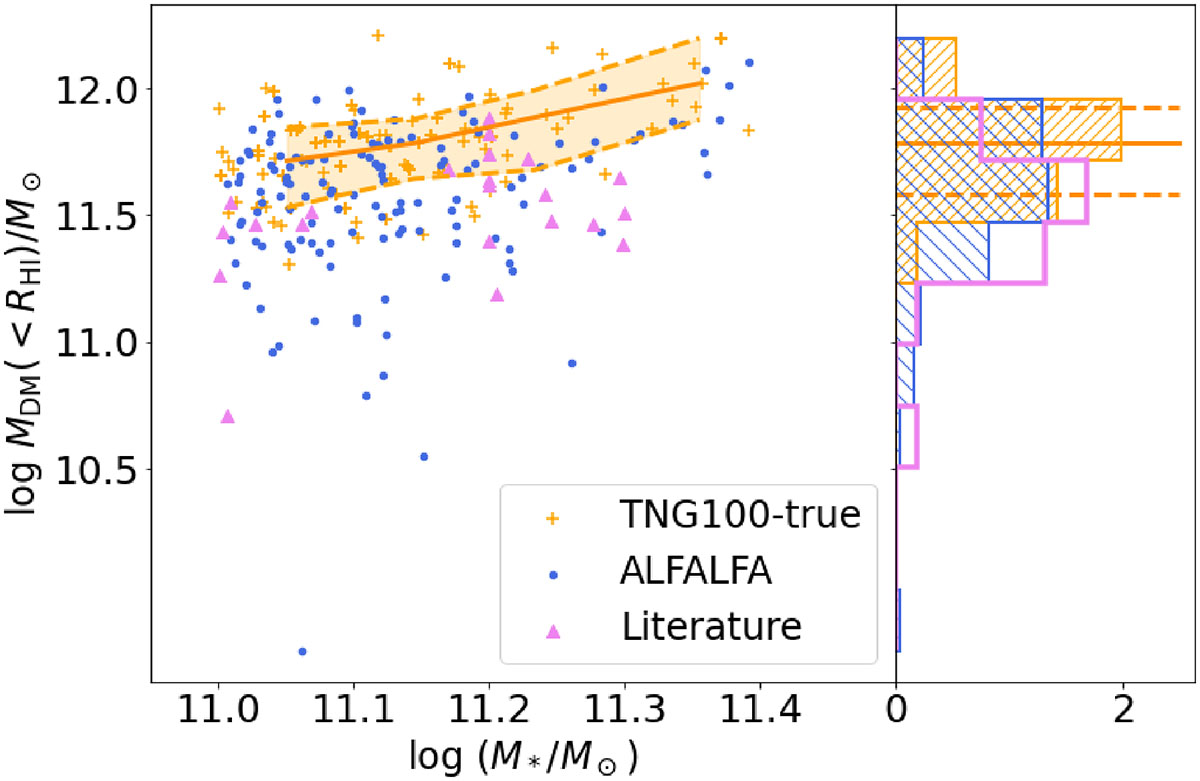
Left: relation between the stellar mass and the enclosed dark matter mass within RHI within the stellar mass range 1011 M⊙ ≤ M* < 1011.4 M⊙. We show the ALFALFA sample in blue, the TNG100-true in orange, and in pink the combined literature late-type galaxies from Posti et al. (2019) and Di Teodoro et al. (2023). The orange solid and dashed lines indicates the median and the 1σ scatter (16th to 84th percentile) for TNG100-true. Right: normalized distributions of the enclosed dark matter mass within RHI for the same samples, plotted in the same colour scheme.
Current usage metrics show cumulative count of Article Views (full-text article views including HTML views, PDF and ePub downloads, according to the available data) and Abstracts Views on Vision4Press platform.
Data correspond to usage on the plateform after 2015. The current usage metrics is available 48-96 hours after online publication and is updated daily on week days.
Initial download of the metrics may take a while.