Open Access
Fig. A.1.
Download original image
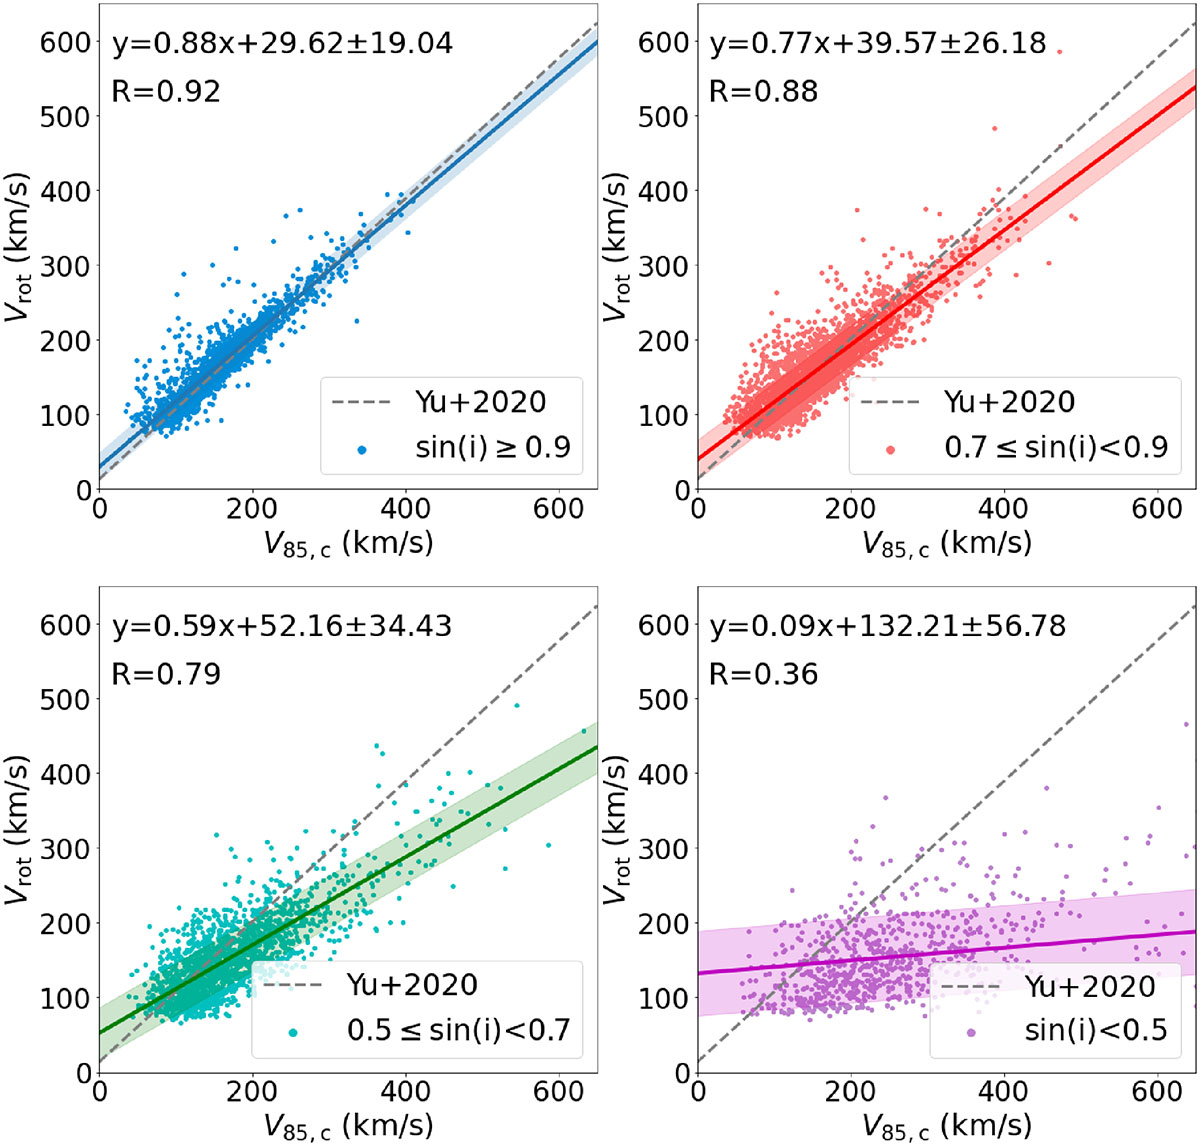
The relationship between rotational and corrected line width indicators for galaxies with different predicted inclinations. In each panel, the solid line and the corresponding shaded area represent the best-fitting line and its 1σ scatter, and the grey dashed line represents the relationship obtained by Yu et al. (2020).
Current usage metrics show cumulative count of Article Views (full-text article views including HTML views, PDF and ePub downloads, according to the available data) and Abstracts Views on Vision4Press platform.
Data correspond to usage on the plateform after 2015. The current usage metrics is available 48-96 hours after online publication and is updated daily on week days.
Initial download of the metrics may take a while.