Fig. 1.
Download original image
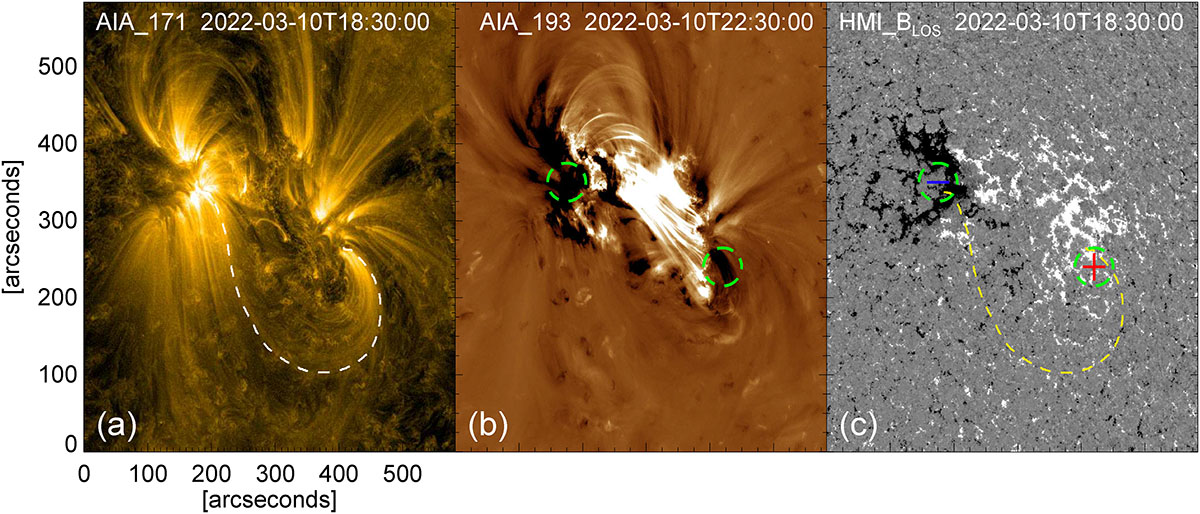
(a) Observation of a sigmoidal loop (marked by the white dashed curve) associated with the pre-eruptive structure as seen in the AIA 171 Å channel. (b) Base difference image obtained from the AIA 193 Å channel. Green circles mark the two conjugate core-dimming regions observed during the eruption. (c) Line-of-sight component of the HMI magnetic field. The yellow dashed curve and the green circles are drawn in (a) and (b), respectively. The underlying magnetic polarities of the two conjugate core-dimming regions and the two ends of the sigmoidal loop are marked, indicating a northeast-directed left-handed flux rope.
Current usage metrics show cumulative count of Article Views (full-text article views including HTML views, PDF and ePub downloads, according to the available data) and Abstracts Views on Vision4Press platform.
Data correspond to usage on the plateform after 2015. The current usage metrics is available 48-96 hours after online publication and is updated daily on week days.
Initial download of the metrics may take a while.