Open Access
Fig. 14.
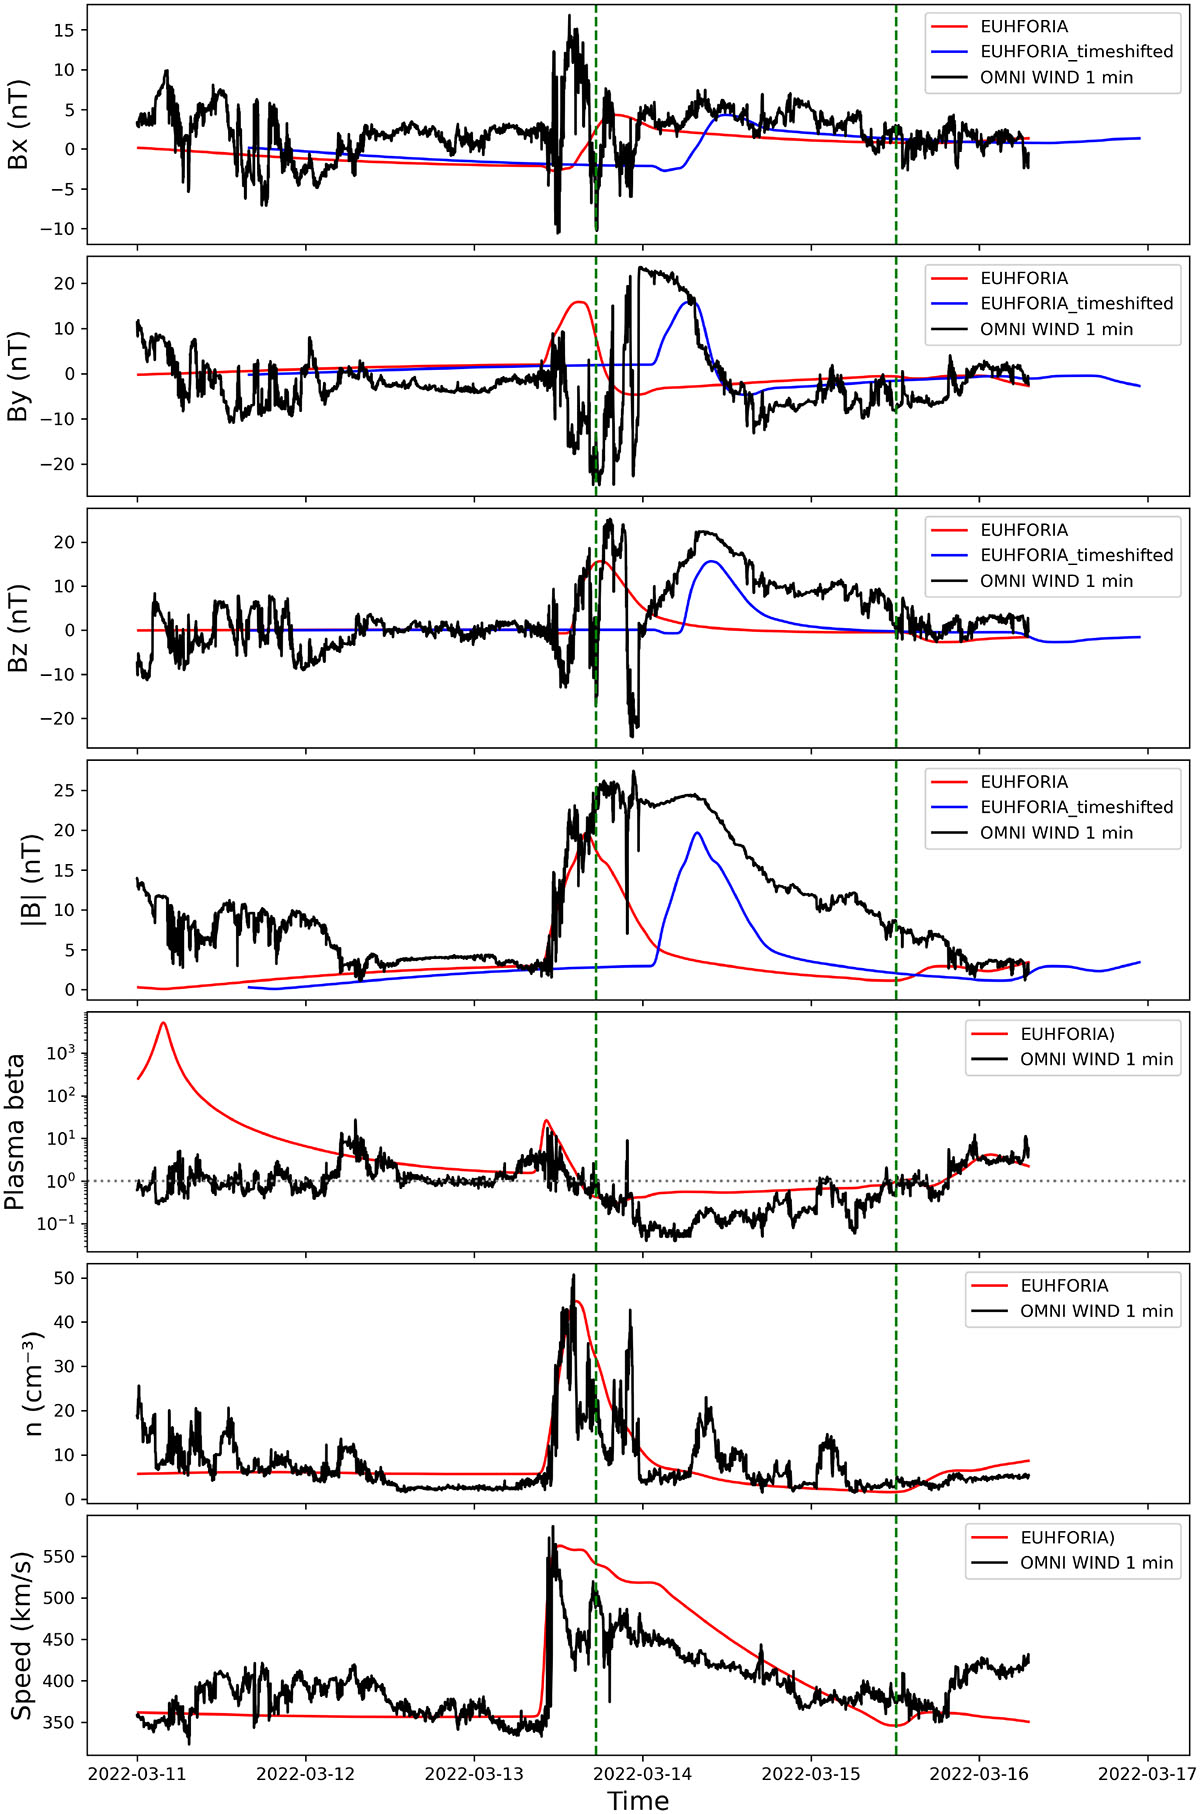
Download original image
Same as Fig. 13, but for WIND data at 0.99 AU. The blue solid lines in the top four plots are the same as the model output, indicated by the red solid lines, but shifted by 15 hours and 48 minutes so that the front edge of both the observed and modelled flux rope temporally coincides.
Current usage metrics show cumulative count of Article Views (full-text article views including HTML views, PDF and ePub downloads, according to the available data) and Abstracts Views on Vision4Press platform.
Data correspond to usage on the plateform after 2015. The current usage metrics is available 48-96 hours after online publication and is updated daily on week days.
Initial download of the metrics may take a while.