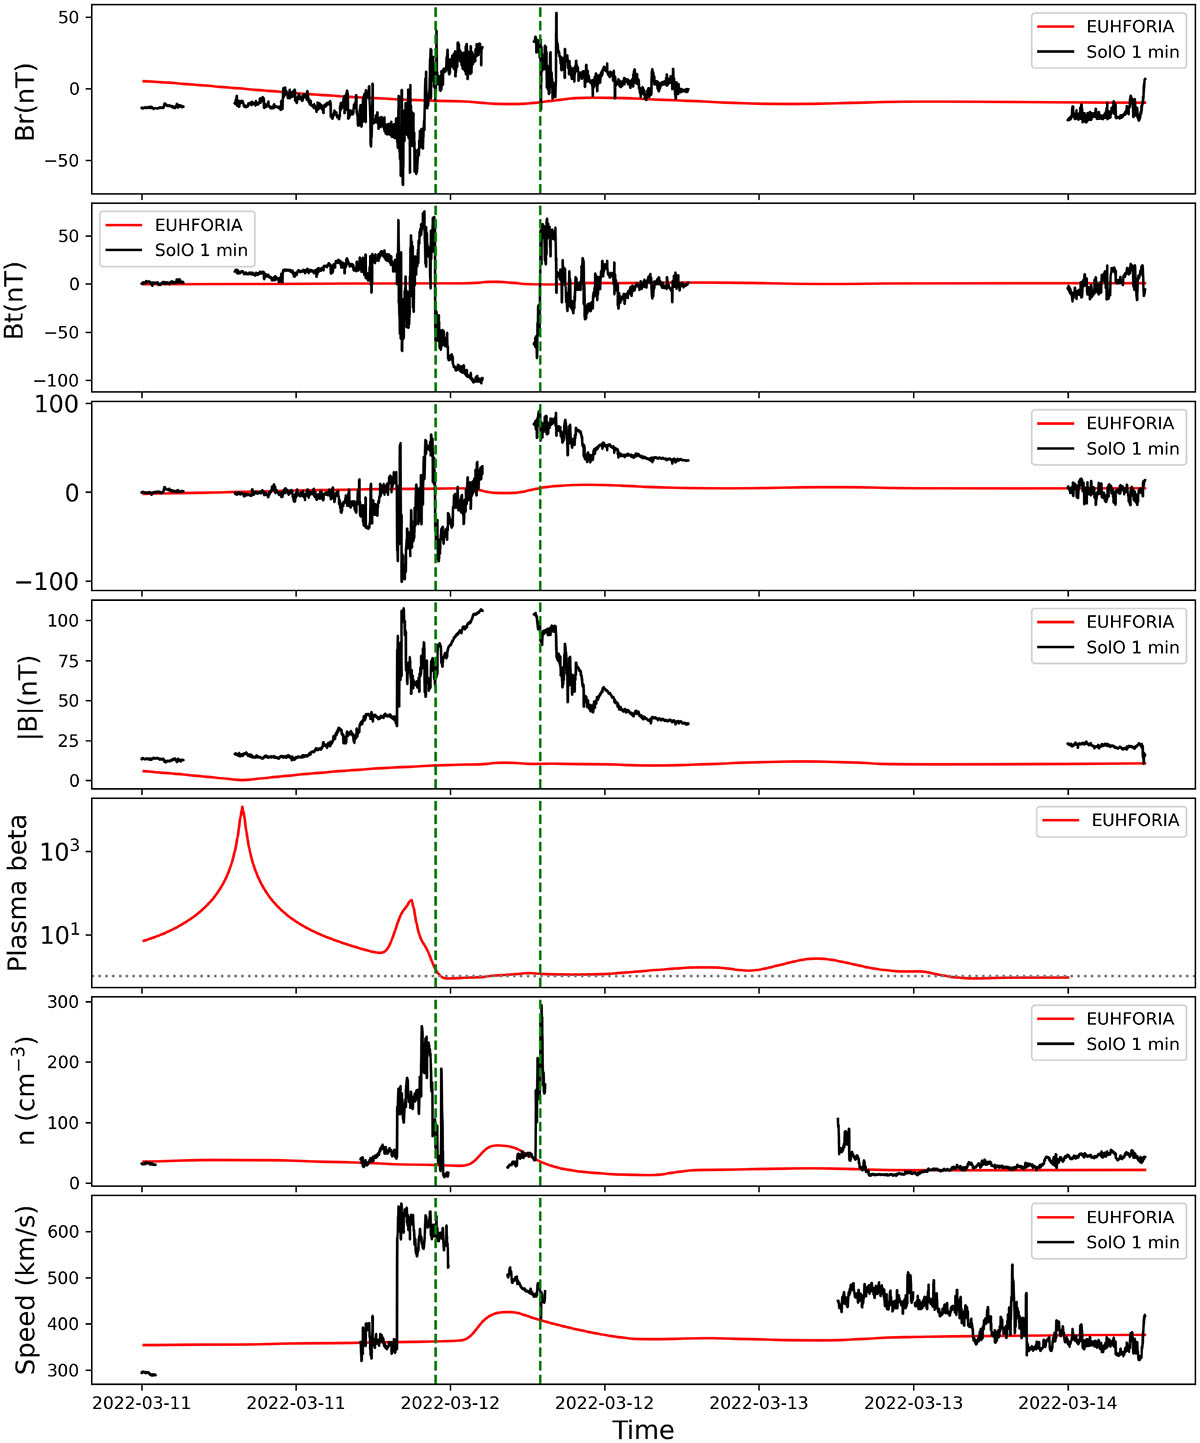
Fig. 2.
Download original image
Comparison of the base run results (model parameters in Table 1) with the in situ magnetic field components in the RTN system, magnetic field strength and plasma properties at 0.43 AU. Solid black curves denote the measurements from SolO, while solid red curves are the model outputs for the three components of the magnetic field (top three plots), the magnetic field strength (middle plot), and the plasma beta, number density and speed, respectively, in the bottom three plots. The vertical dashed green lines mark the estimated magnetic cloud boundaries.
Current usage metrics show cumulative count of Article Views (full-text article views including HTML views, PDF and ePub downloads, according to the available data) and Abstracts Views on Vision4Press platform.
Data correspond to usage on the plateform after 2015. The current usage metrics is available 48-96 hours after online publication and is updated daily on week days.
Initial download of the metrics may take a while.