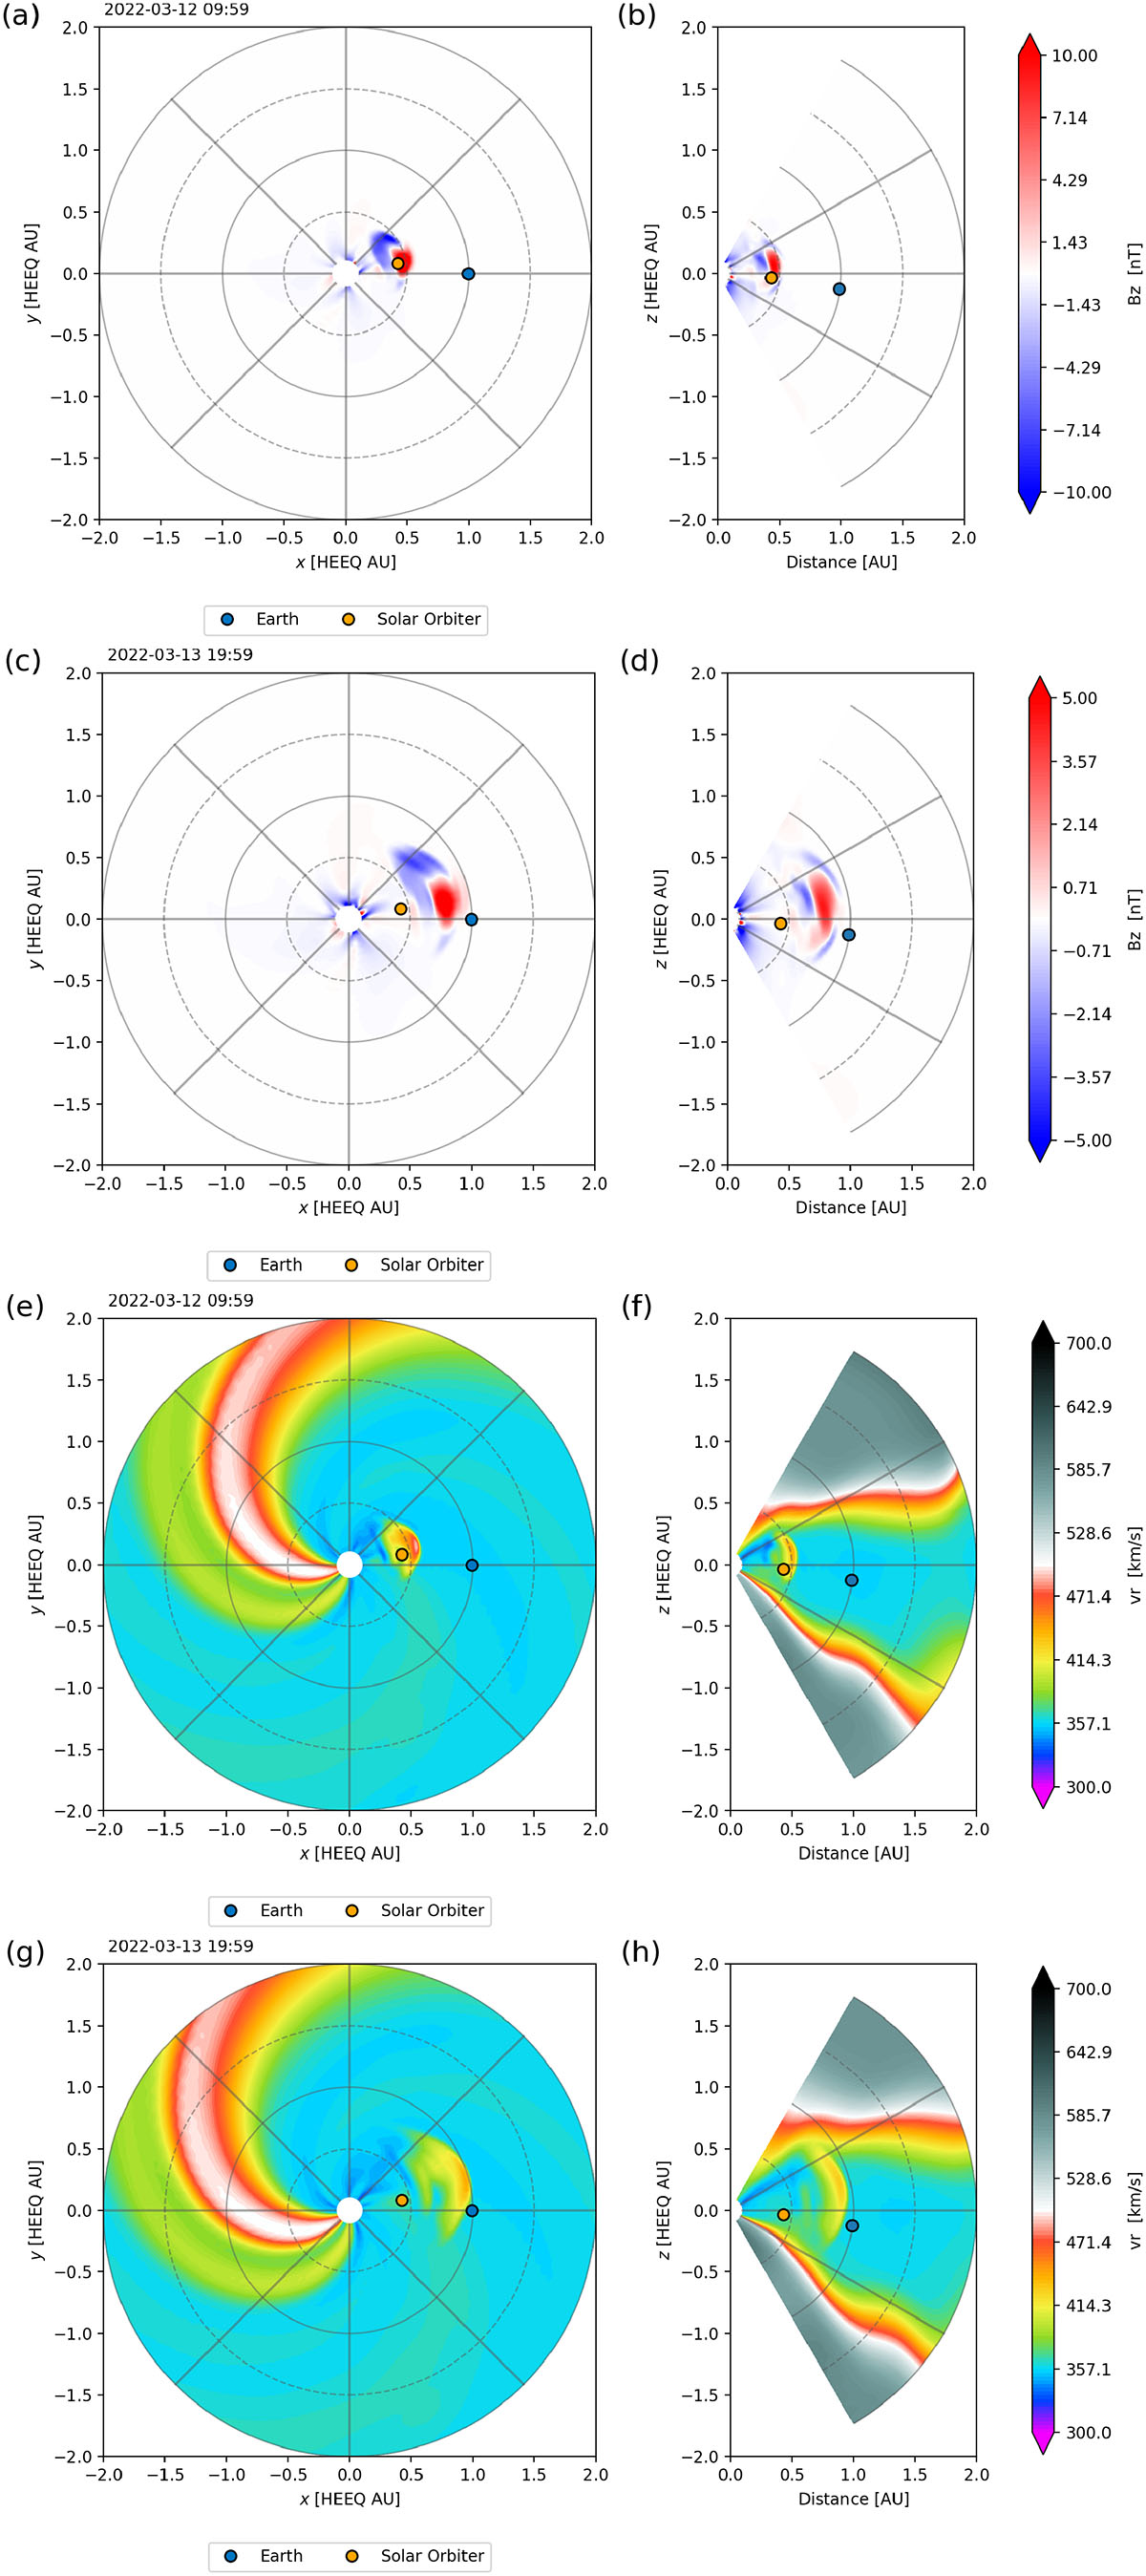
Fig. 4.
Download original image
Base simulation results showing the CME evolution in equatorial (left) and meridional (right) planes. Panels (a–d) display the magnetic field component Bz (nT). Panels (e–h) display the radial velocity Vr (km/s), at 2022-03-12 09:59 UT (a–b, e–f) and 2022-03-13 19:59 UT (c–d, g–h). Left panels (a, c, e, g) show a top-down view of the CME propagation on the equatorial plane, while the right-hand panels (b, d, f, h) show the meridional plane, giving a side-on view of its vertical extent and latitudinal structure. The concentric circles indicate heliocentric distance contours and serve as radial reference markers.
Current usage metrics show cumulative count of Article Views (full-text article views including HTML views, PDF and ePub downloads, according to the available data) and Abstracts Views on Vision4Press platform.
Data correspond to usage on the plateform after 2015. The current usage metrics is available 48-96 hours after online publication and is updated daily on week days.
Initial download of the metrics may take a while.