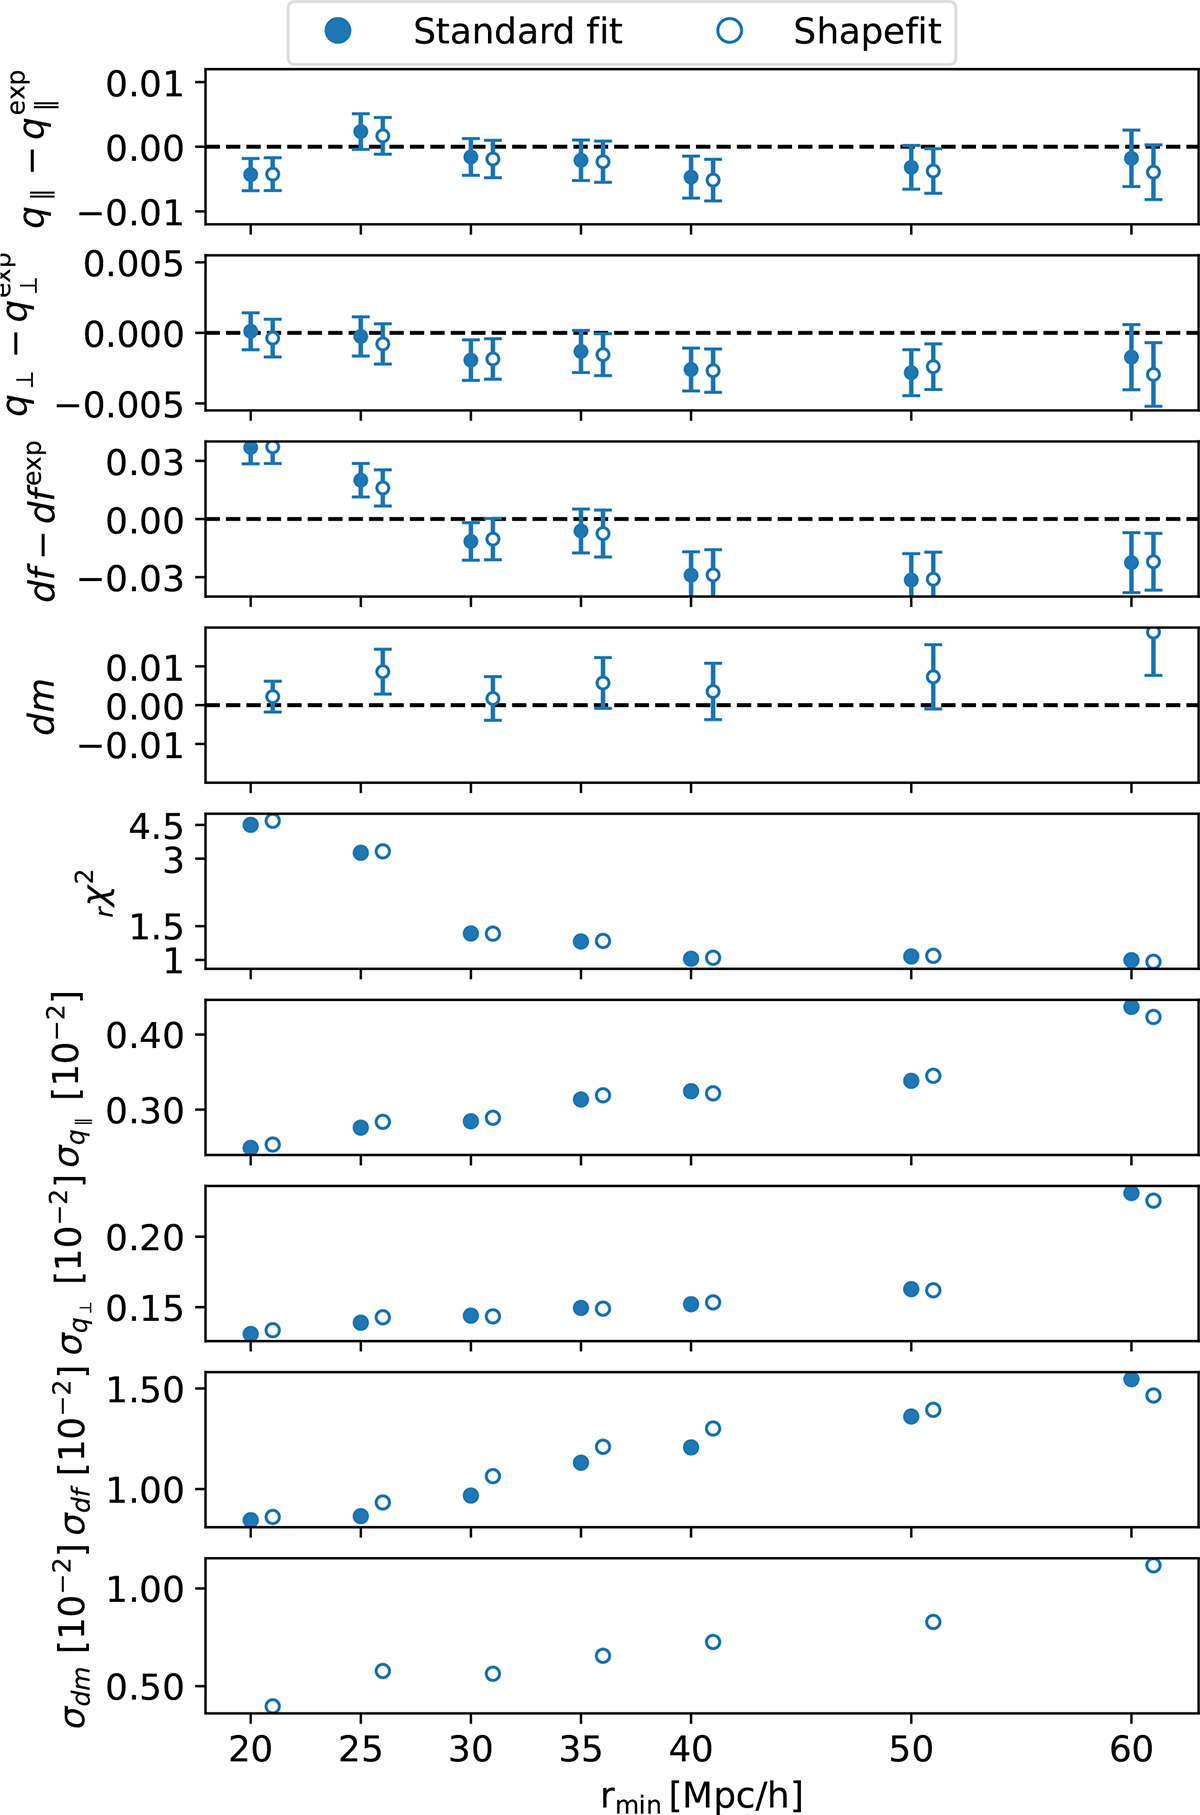
Fig. 1.
Download original image
Configuration space RSD results from fits to the average clustering of 25 LRG cubic-box N-body simulations as a function of the minimum separation scale, rmin. Best-fit values of q∥, q⊥, df, and dm are compared to their expected values in the top panels. The mid panel shows the reduced chi-squared rχ2, and the bottom three panels display estimated uncertainties σq∥, σq⊥, σdf, and σdm. Filled markers represent the baseline fit while empty markers indicate fits that include the additional ShapeFit parameter m.
Current usage metrics show cumulative count of Article Views (full-text article views including HTML views, PDF and ePub downloads, according to the available data) and Abstracts Views on Vision4Press platform.
Data correspond to usage on the plateform after 2015. The current usage metrics is available 48-96 hours after online publication and is updated daily on week days.
Initial download of the metrics may take a while.