Open Access
Fig. 5.
Download original image
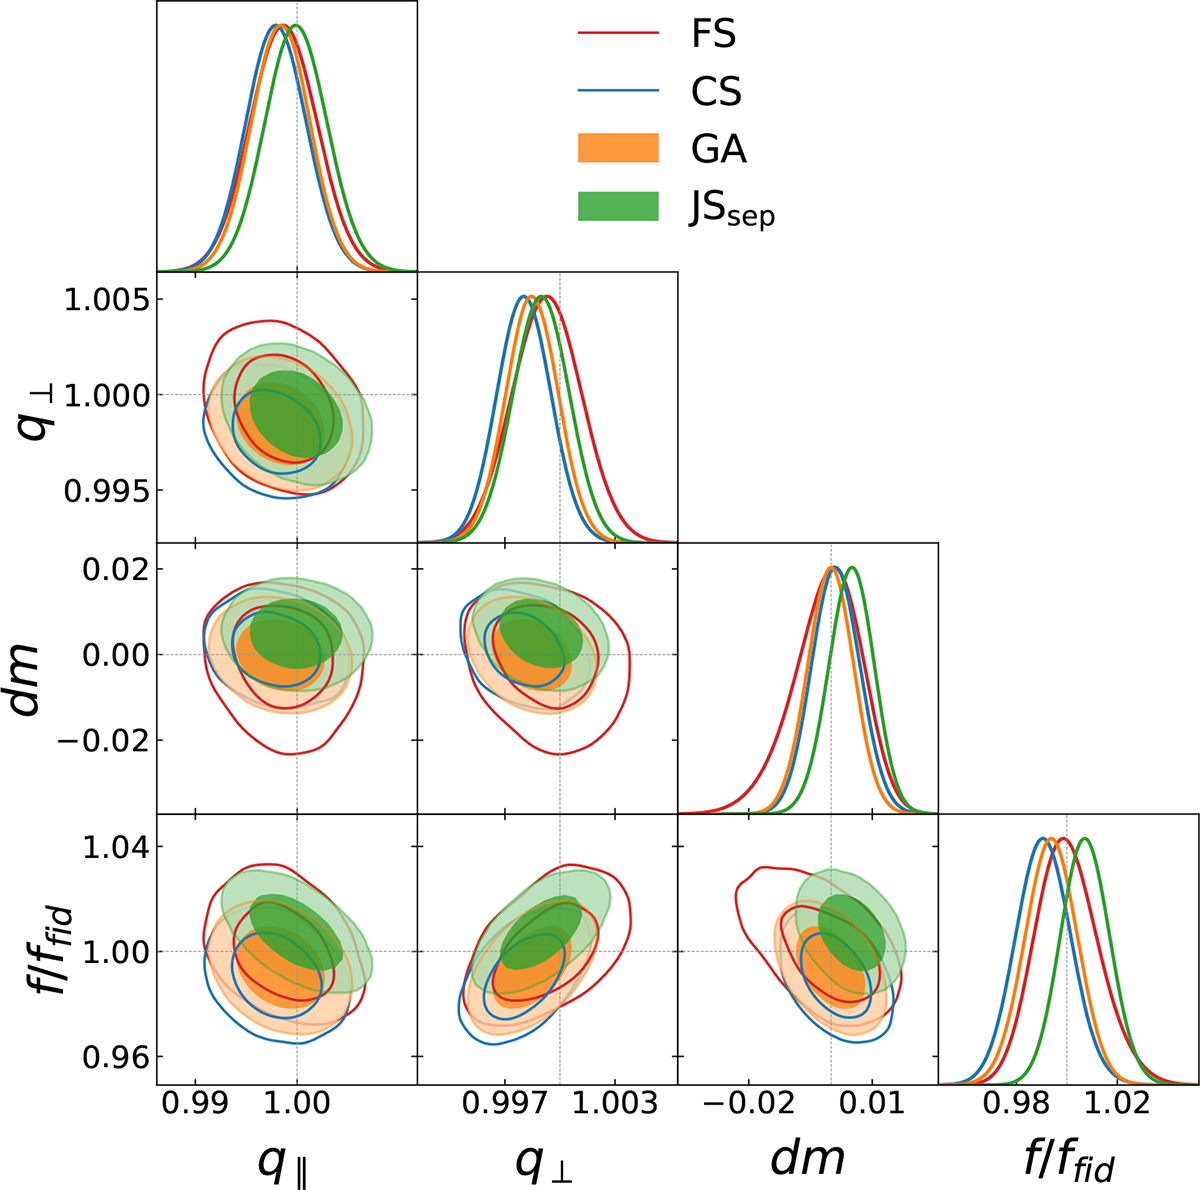
Contours of 68 and 95 percent of the posterior distributions for FS (red), CS (blue), JSsep (green), and GA (orange) derived from fits to the average clustering of 25 LRG cubic-box mocks from N-body simulations.
Current usage metrics show cumulative count of Article Views (full-text article views including HTML views, PDF and ePub downloads, according to the available data) and Abstracts Views on Vision4Press platform.
Data correspond to usage on the plateform after 2015. The current usage metrics is available 48-96 hours after online publication and is updated daily on week days.
Initial download of the metrics may take a while.