Fig. 7.
Download original image
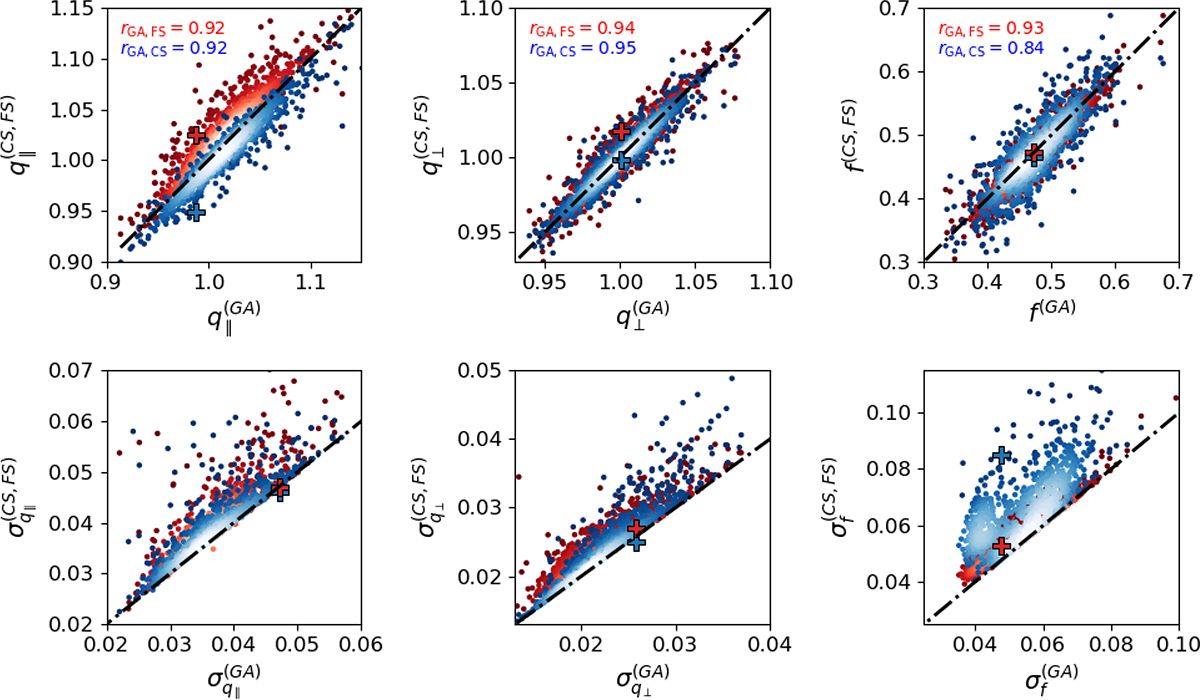
Comparison of the RSD measurements in FS (red) and CS (blue) with GA on the individual 1000 eBOSS EZmock. FS and CS results are shown on the y-axis, while GA results are on the x-axis. The top row displays the best-fit values for q∥, q⊥, and fσ8, while the bottom row shows their estimated errors σq∥, σq⊥, and σfσ8. The density of points is represented by the color-scale shading, and the dashed lines indicate the line of perfect correlation where the compared parameters are equal. We display the Pearson correlation coefficients between GA and FS, as well as GA and CS. The plus symbols represent the best-fit results from the real eBOSS data as listed in Table 6.
Current usage metrics show cumulative count of Article Views (full-text article views including HTML views, PDF and ePub downloads, according to the available data) and Abstracts Views on Vision4Press platform.
Data correspond to usage on the plateform after 2015. The current usage metrics is available 48-96 hours after online publication and is updated daily on week days.
Initial download of the metrics may take a while.