Open Access
Fig. 4
Download original image
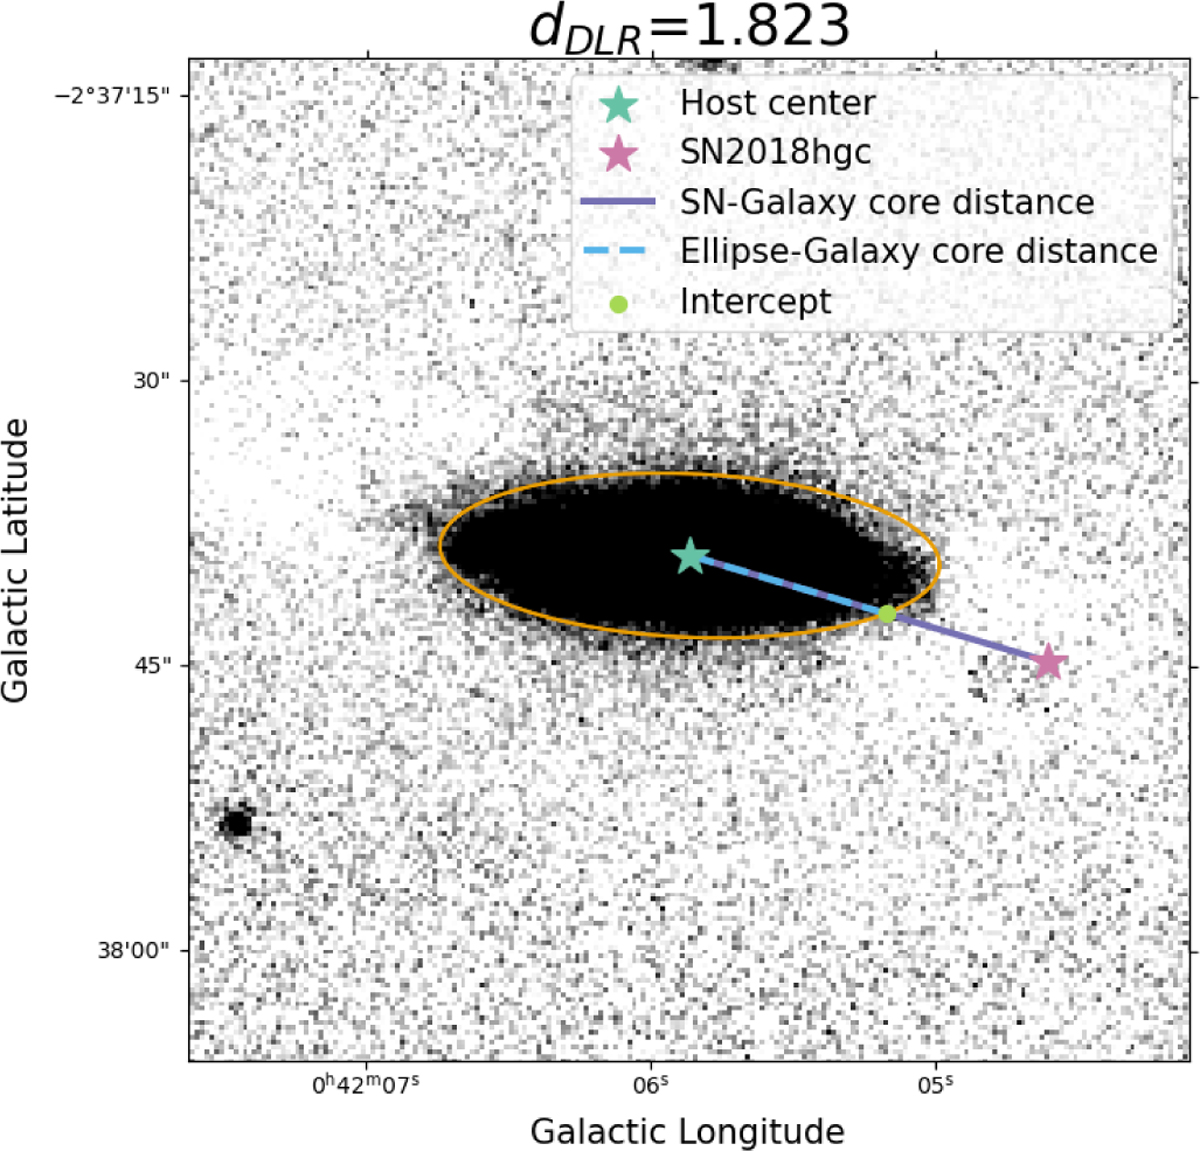
Example of measuring dDLR. The shape of the host was measured using sep and is plotted in orange. The dDLR is the ratio of the distance from the host center to the SN (purple) and the distance from the host center to the edge of the ellipse (dashed blue).
Current usage metrics show cumulative count of Article Views (full-text article views including HTML views, PDF and ePub downloads, according to the available data) and Abstracts Views on Vision4Press platform.
Data correspond to usage on the plateform after 2015. The current usage metrics is available 48-96 hours after online publication and is updated daily on week days.
Initial download of the metrics may take a while.