Fig. 7
Download original image
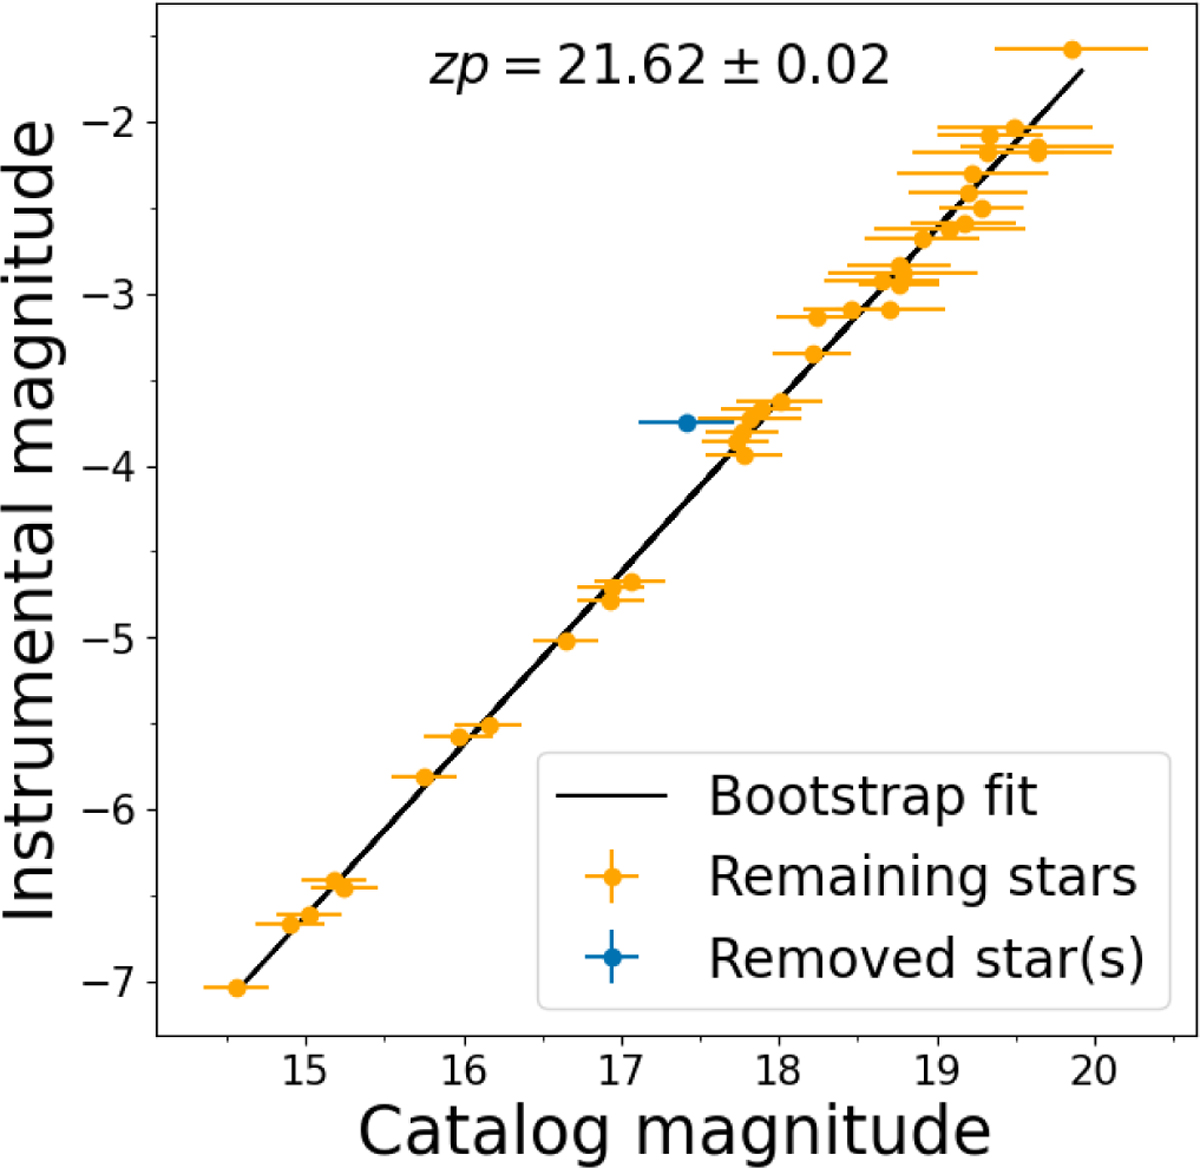
Example of calculating an image zeropoint using bootstrapping with sigma clipping as outlier rejection, where the standard deviation from Chauvenet’s criteria was used. At the top of the panel, we show the image zeropoint and its error, the black line shows the fit using a linear function in the form of f(x)=x+b, the orange points represent the stars that remained after the sigma clipping, and the blue point(s) show rejected stars. The zeropoint is the intercept value from the fit.
Current usage metrics show cumulative count of Article Views (full-text article views including HTML views, PDF and ePub downloads, according to the available data) and Abstracts Views on Vision4Press platform.
Data correspond to usage on the plateform after 2015. The current usage metrics is available 48-96 hours after online publication and is updated daily on week days.
Initial download of the metrics may take a while.