Fig. 1
Download original image
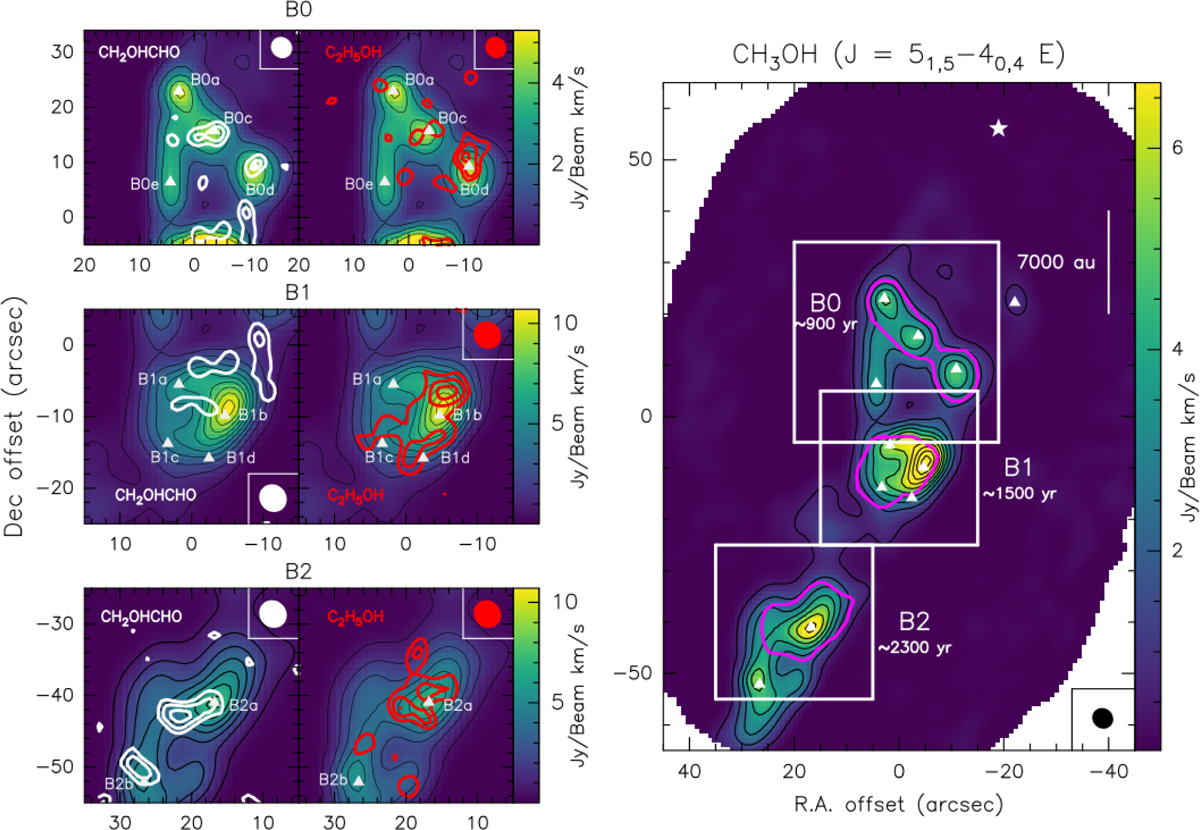
Zoom on the three shocked regions. The left panel shows a zoom on the GA and ethanol emission maps toward B0, B1, and B2, integrated over the velocity range [−10,5] km s−1. The velocity-integrated emission is shown by white and red contours for the GA and ethanol lines, respectively, overlaid on the emission of the CH3OH line 51,5−40,4 in color scale. For the GA and ethanol lines, the first contours are drawn at 3σ and the subsequent contours are plotted in steps of 1σ (1σ = 15 mJy/beam km/s for CH2OHCHO and 12 mJy/beam km/s for C2H5OH in B0 and B1; 18 mJy/beam km/s for CH2OHCHO and 14 mJy/beam km/s for C2H5OH in B2). The ellipses in the corners indicate the synthesized beams for each GA and ethanol line. The white triangles and associated labels mark the different clumps identified by Benedettini et al. (2007). The right panel shows the velocity-integrated intensity map of the CH3OH 51,5−40,4 line, illustrating the morphology of the overall L1157 southern molecular outflow. The methanol map was used to define the polygons (shown by magenta contours) within which the intensities used for the column density computations are integrated (see text). The methanol map is centered at α(J2000) = 20h39m09.635s and δ(J2000) = 68°01′19.80″. The first contour is drawn at 50σ and subsequent contours are plotted in steps of 100σ (1σ = 11 mJy/beam km/s). The black ellipse in the bottom right corner indicates the synthesized beam of the CH3OH line. The white squares centered on B0, B1 and B2 delimit the areas of the zoomed maps shown in the left panels. The white star at the top of the map marks the position of the unresolved L1157 protobinary system (Tobin et al. 2013, 2022).
Current usage metrics show cumulative count of Article Views (full-text article views including HTML views, PDF and ePub downloads, according to the available data) and Abstracts Views on Vision4Press platform.
Data correspond to usage on the plateform after 2015. The current usage metrics is available 48-96 hours after online publication and is updated daily on week days.
Initial download of the metrics may take a while.