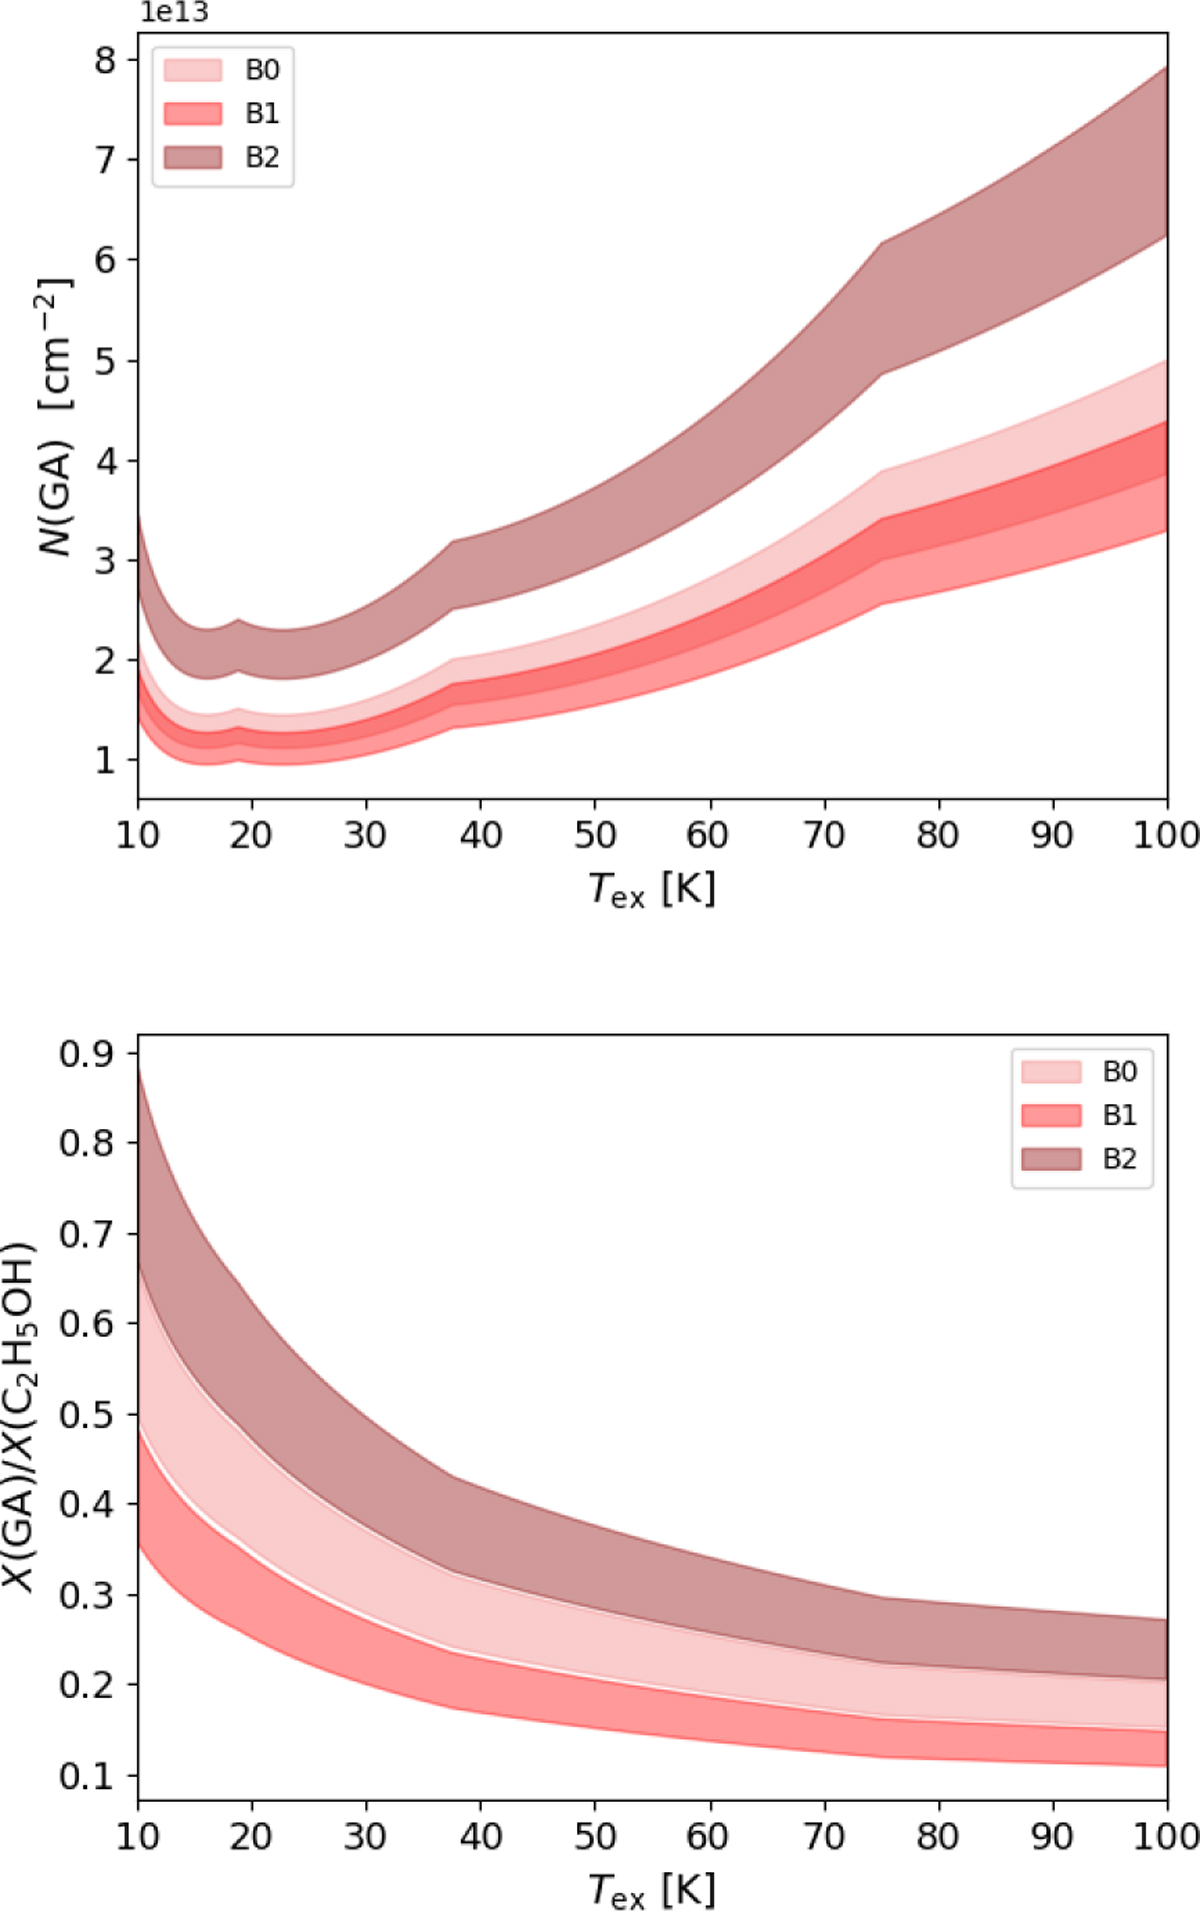
Fig. 2
Download original image
Glycolaldehyde (GA) column density and abundance ratio, computed from the 101,10−90,9 line, which is the brightest, assuming LTE population and optically thin line emission. The bands represent the uncertainty associated with the line intensity (see text). Upper panel: column density of GA in B0 (light pink), B1 (pink) and B2 (dark pink), as a function of the excitation temperature Tex. The column density values partially overlap in B0 and B1. Lower panel: GA/ethanol abundance ratio versus Texc in B0, B1 and B2 (same color coding as above).
Current usage metrics show cumulative count of Article Views (full-text article views including HTML views, PDF and ePub downloads, according to the available data) and Abstracts Views on Vision4Press platform.
Data correspond to usage on the plateform after 2015. The current usage metrics is available 48-96 hours after online publication and is updated daily on week days.
Initial download of the metrics may take a while.