Fig. 3
Download original image
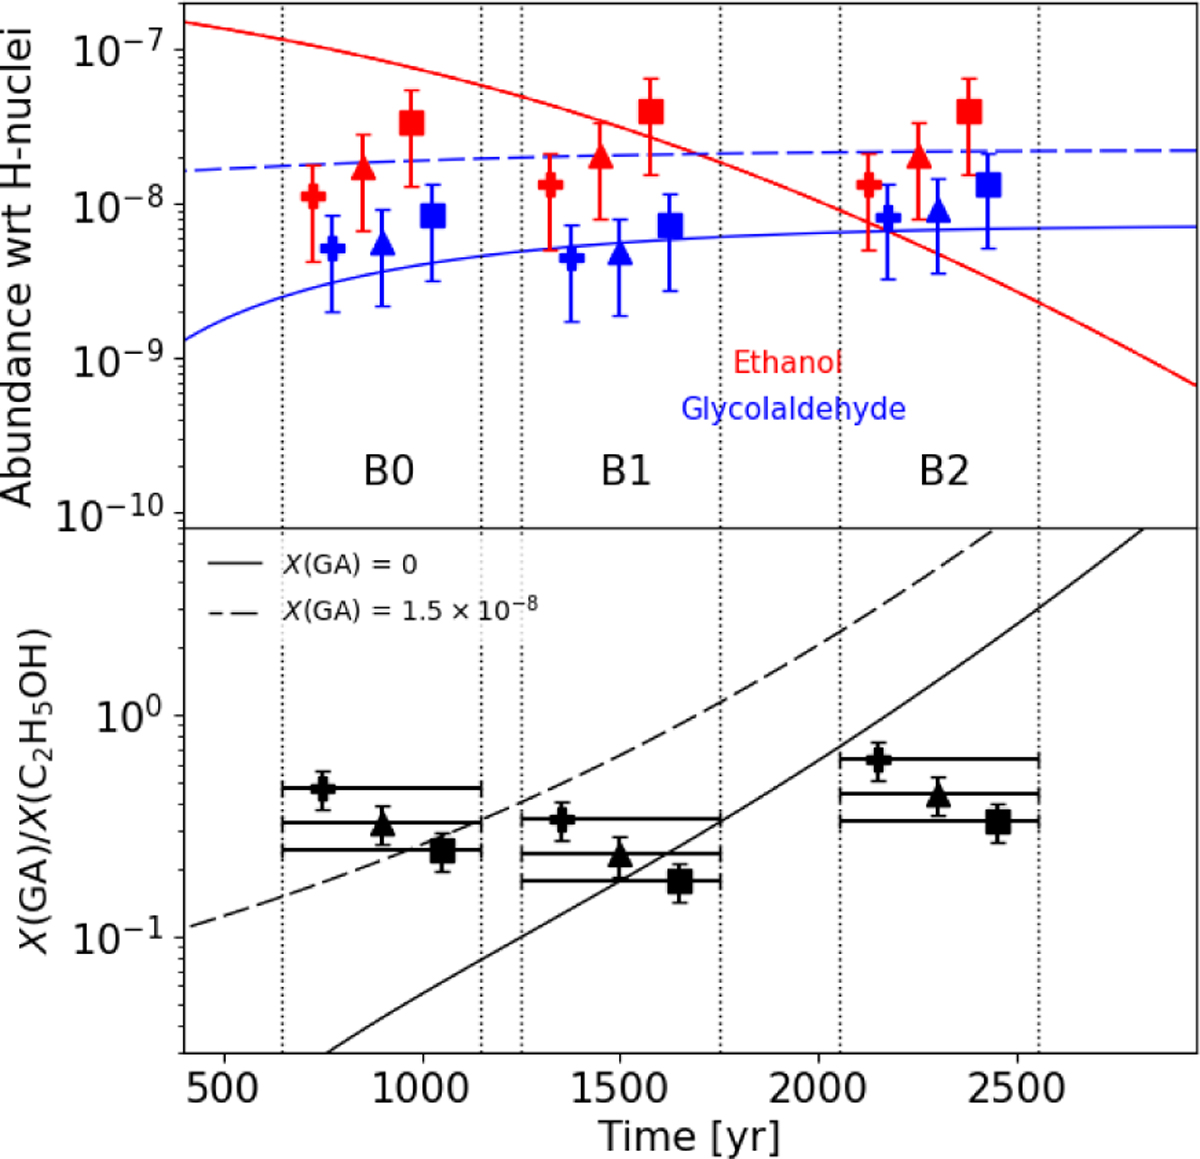
Results of the chemical modeling obtained for the reference model parameters (listed in Table 4) compared with the observations. The curves shows the predicted abundances (relative to H-nuclei) of GA (blue) and ethanol (red) in the upper panel, and the GA/ethanol abundance ratios in the lower panel as a function of time. The symbols represent the values assuming Tex equal to 15 (crosses), 30 (triangles) and 50 (squares) K, as measured at B0, B1 ans B2, respectively. The solid lines correspond to the reference model without GA injection from the dust grains, whereas the dashed lines correspond to the reference model with an injected GA abundance X(CH2OHCHO) = 1.5 × 10⁻⁸.
Current usage metrics show cumulative count of Article Views (full-text article views including HTML views, PDF and ePub downloads, according to the available data) and Abstracts Views on Vision4Press platform.
Data correspond to usage on the plateform after 2015. The current usage metrics is available 48-96 hours after online publication and is updated daily on week days.
Initial download of the metrics may take a while.