Fig. 4
Download original image
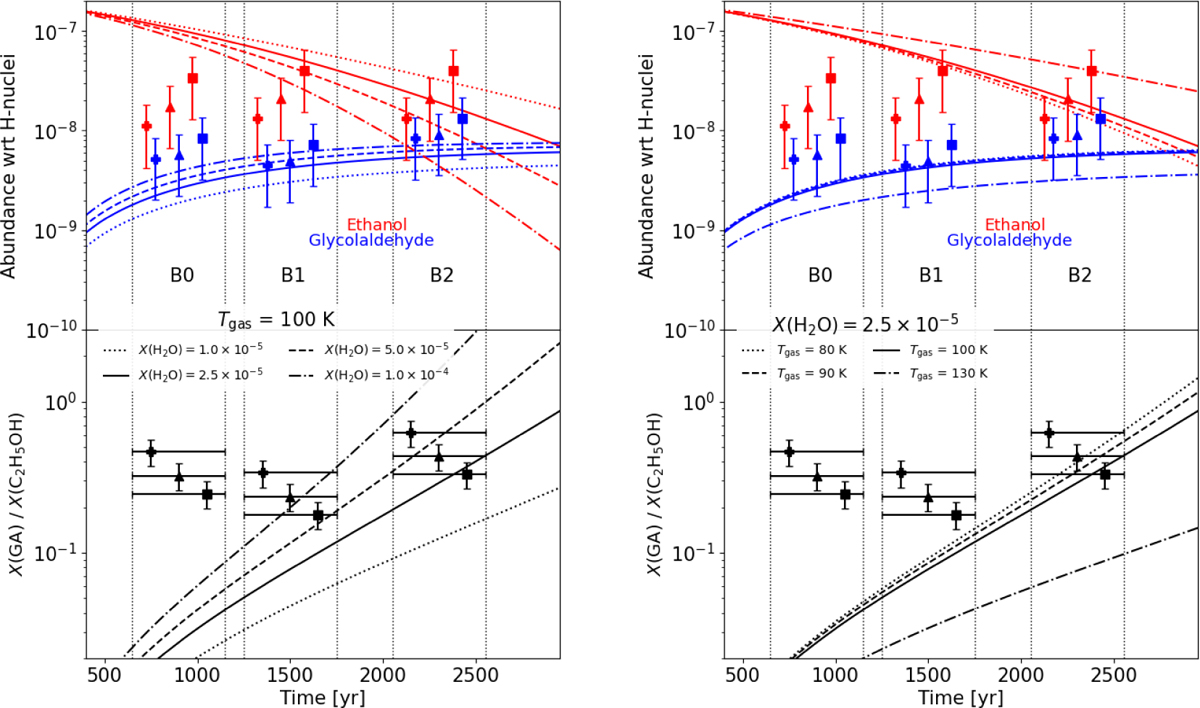
Results obtained assuming that GA forms exclusively in the gas phase via the ethanol tree. Model predictions (curves) are compared with observations (symbols) toward B0, B1 and B2, assuming three excitation temperatures Tex = 15 K (crosses), 30 K (triangles) and 50 K (squares) . In each figure, the upper panels show the abundances of GA (blue) and ethanol (red) as a function of time. The bottom panels show the evolution with time of the GA/ethanol abundance ratio. Left panel: predictions obtained assuming a temperature of 100 K and four values for the injected H2O abundances: 1.0 (dotted), 2.5 (solid), 5.0 (dashed) and 10 (dotted-dashed) ×10−5). Right panel: predictions obtained assuming an injected H2O abundance of 2.5 × 10⁻⁵ and four temperature values: 80 K (dotted), 90 K (dashed), 100 K (solid) and 130 K (dotted-dashed).
Current usage metrics show cumulative count of Article Views (full-text article views including HTML views, PDF and ePub downloads, according to the available data) and Abstracts Views on Vision4Press platform.
Data correspond to usage on the plateform after 2015. The current usage metrics is available 48-96 hours after online publication and is updated daily on week days.
Initial download of the metrics may take a while.