Fig. A.1
Download original image
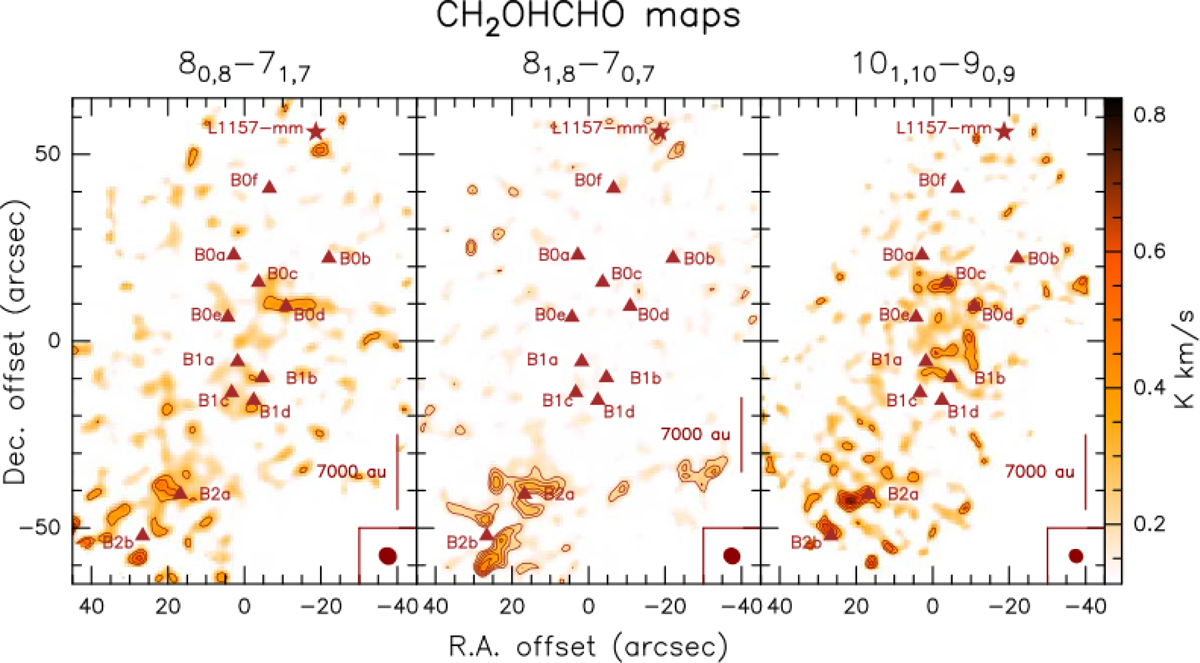
Maps of the emission of GA along the entire southern outflow of L1157, for all three transitions. The first contours are drawn at 3σ and the following with a step of 1σ (1σ = 0.1 K km s−1 for the 80,8 − 71,7 transition, 0.05 K km s−1 for the S1,s − 70,7 transition and 0.1 K km s−1 for the 101,10 – 90,9 transition). Note that we masked out the noise at the edge of the maps, and that the rms was estimated at the center of the maps; therefore the first contour might be at slightly less than 3σ in B2, which is close to the noisier edge of the maps.
Current usage metrics show cumulative count of Article Views (full-text article views including HTML views, PDF and ePub downloads, according to the available data) and Abstracts Views on Vision4Press platform.
Data correspond to usage on the plateform after 2015. The current usage metrics is available 48-96 hours after online publication and is updated daily on week days.
Initial download of the metrics may take a while.