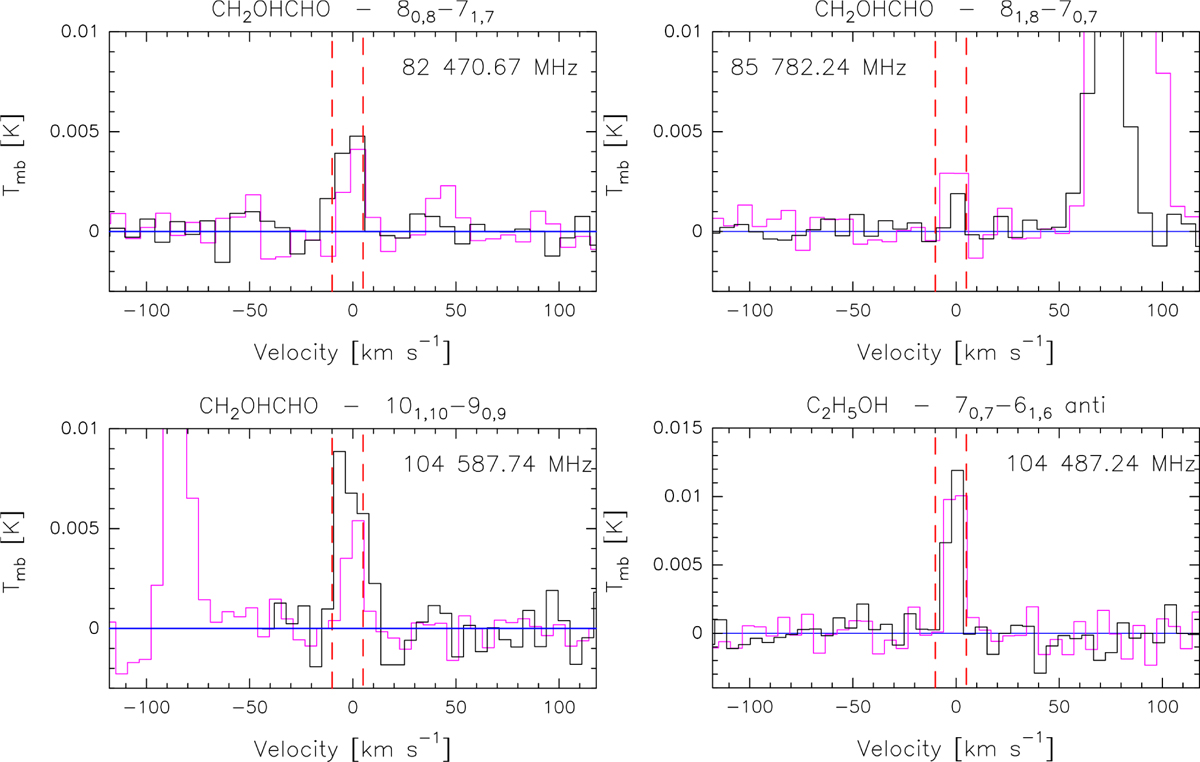
Fig. B.1
Download original image
Spectra obtained with the IRAM 30-meter (in purple) as part of the ASAI large program vs spectra from our observations obtained with the NOEMA radio-interferometer (in black). In order to compare these two datasets, we degraded the spectral resolution of the ASAI data to 2 MHz. The dotted red lines mark the velocity range over which the flux was integrated. The NOEMA spectra were obtained by spatially averaging the flux over the half-power beam size of the IRAM 30-m telescope used for the ASAI observations. The horizontal blue line marks the zero intensity level of each spectrum.
Current usage metrics show cumulative count of Article Views (full-text article views including HTML views, PDF and ePub downloads, according to the available data) and Abstracts Views on Vision4Press platform.
Data correspond to usage on the plateform after 2015. The current usage metrics is available 48-96 hours after online publication and is updated daily on week days.
Initial download of the metrics may take a while.