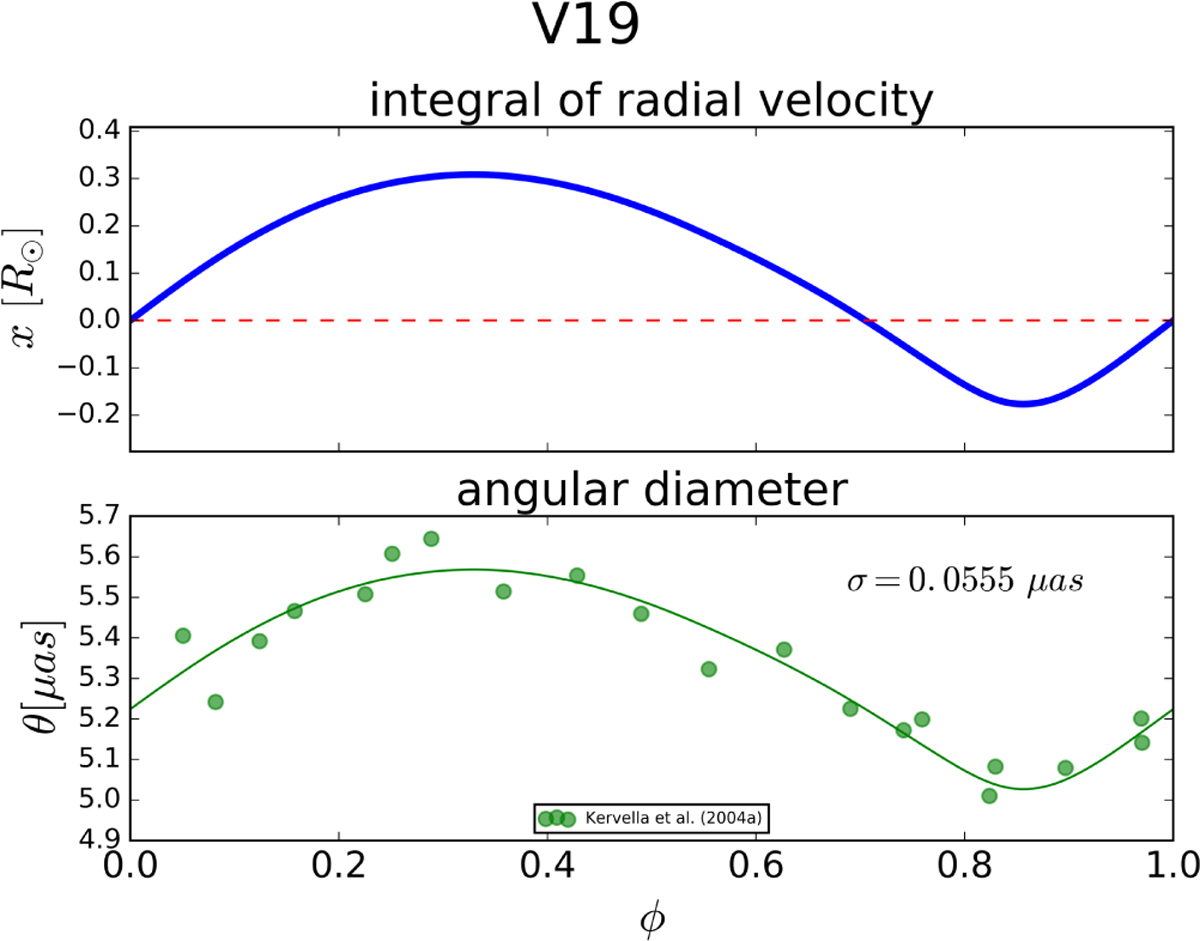
Fig. 2
Download original image
Top: integral of the RV curve. Bottom: course of the angular diameter based on one of the five used SBCRs for V 19. The curve in the bottom panel is not a fit, but the curve from the top scaled by 2pϖ. The slope results from the bisector fit. The plots corresponding to all stars and all assumed SBCRs are available on Zenodo.
Current usage metrics show cumulative count of Article Views (full-text article views including HTML views, PDF and ePub downloads, according to the available data) and Abstracts Views on Vision4Press platform.
Data correspond to usage on the plateform after 2015. The current usage metrics is available 48-96 hours after online publication and is updated daily on week days.
Initial download of the metrics may take a while.