| Issue |
A&A
Volume 706, February 2026
|
|
|---|---|---|
| Article Number | A268 | |
| Number of page(s) | 14 | |
| Section | Stellar atmospheres | |
| DOI | https://doi.org/10.1051/0004-6361/202556144 | |
| Published online | 17 February 2026 | |
Distance to the globular cluster M 3 from the infrared surface brightness technique applied to RR Lyrae stars
1
Universidad de Concepción, Departamento de Astronomía,
Casilla 160-C,
Concepción,
Chile
2
Nicolaus Copernicus Astronomical Center, Polish Academy of Sciences,
Bartycka 18,
00-716
Warszawa,
Poland
3
Leibniz-Institut für Astrophysik Potsdam (AIP),
An der Sternwarte 16,
14482
Potsdam,
Germany
4
Université Côte d’Azur, Observatoire de la Côte d’Azur, CNRS, Laboratoire Lagrange,
France
5
Instituto de Alta Investigación, Universidad de Tarapacá,
Casilla 7D,
Arica,
Chile
6
LESIA, Observatoire de Paris, Université PSL, CNRS, Sorbonne Université, Université Paris Cité,
5 place Jules Janssen,
92195
Meudon,
France
7
Universidad de Chile, Departamento de Astronomía,
Camino el Observatorio 1515,
Santiago,
Chile
★ Corresponding author: This email address is being protected from spambots. You need JavaScript enabled to view it.
Received:
27
June
2025
Accepted:
5
December
2025
Abstract
Context. The infrared surface brightness (IRSB) technique is a specific application of the Baade-Wesselink method. Given proper calibration, well-covered optical and near-infrared photometry, as well as radial velocity curves, it allows the estimation of distances to individual pulsating stars and the determination of their mean radii. Even though it is observationally demanding, it offers a way of distance determination to systems of pulsating stars that is independent of period-luminosity relations. The technique is fully empirical and does not depend on stellar atmosphere models.
Aims. The goal of the work is to test the precision of distance determinations to individual RR Lyrae stars and to their host system as a whole using the IRSB technique for a relatively distant globular cluster M 3 (NGC 5272). We also determined the mean radii and period-radius relations for these stars in order to compare them with the existing theoretical predictions and empirical estimations for the field stars from the solar neighborhood.
Methods. We used the data available in the literature and the calibration of the IRSB technique based on the RR Lyrae stars from the solar neighborhood we published previously in order to determine distances to 14 RR Lyrae stars in the globular cluster M 3. We applied the IRSB technique, as previously presented in our work for RR Lyraes, from the solar vicinity with an extra determination and implementation of phase shifts between observables due to the phase incoherence of data gathered at different epochs. We studied the impact of the selection of the fitting procedure (bisector vs. the least-squares fit) on the results. We applied five different empirical surface brightness-color relations from the literature in the analysis.
Results. We obtained a mean distance to M 3 of rM3 = (10.07 ± 0.19 ± 0.29) kpc, which corresponds to a distance modulus μM3 = (15.015 ± 0.041 ± 0.063) mag and a 7% scatter of individual stellar distances for 14 RR Lyrae stars in M 3. We obtained a very good agreement between the two fitting techniques; the bisector proved to be a biased estimator, while the least-squares fit yielded slightly larger uncertainties. We also determined mean stellar radii for pulsators in the sample with a precision of 0.5% and obtained excellent agreement with a theoretical prediction of the period-radius relation for RRab stars available in the literature.
Key words: stars: distances / stars: oscillations / stars: variables: RR Lyrae / globular clusters: general / infrared: stars
© The Authors 2026
 Open Access article, published by EDP Sciences, under the terms of the Creative Commons Attribution License (https://creativecommons.org/licenses/by/4.0), which permits unrestricted use, distribution, and reproduction in any medium, provided the original work is properly cited.
This article is published in open access under the Subscribe to Open model. This email address is being protected from spambots. You need JavaScript enabled to view it. to support open access publication.
1 Introduction
The infrared surface brightness (IRSB) technique is a specific application of the Baade-Wesselink (BW) method (Baade 1926; Wesselink 1946) that allows changes in the size of a radially pulsating star to be traced. The purposes of such an analysis may vary, but usually they come down to the determination of distances to individual pulsating stars through the simple ratio of the stellar linear diameter to angular diameter. The method also allows the determination of mean stellar radii. While variations in the radius can be derived from the integration of the radial velocity (RV) curve obtained using a spectrograph, the angular diameter is determined for the corresponding pulsation phases simultaneously using an independent observing method. In principle, stellar angular diameters can be measured directly through interferometry, but this is an observationally and technologically demanding type of observation. However, as originally found by Barnes & Evans (1976), empirical relations between photometric magnitudes and stellar angular diameter are possible to be calibrated. These are known in the literature as the surface brightness-color relations (SBCRs). In this approach, interferometric observations are performed only for a calibrating sample of a given stellar species in order to calibrate a SBCR. Later, the relation is applied to estimate angular diameters of objects where interferometry is not available. This reasoning was applied for the detached eclipsing binary systems of the Magellanic Clouds, and provided the most precise distances currently available for these galaxies (1% for the LMC and 2% for the SMC, Pietrzyński et al. 2019; Graczyk et al. 2020).
Analyses performed in the 1990s for classical Cepheids by Welch (1994) and Fouqué & Gieren (1997) showed that, among different combinations of considered photometric passbands, the most precise estimation of angular diameters is obtained based on SBCRs, which depend on the optical V band and the (V - K) color, where K is the broadband centered on 2.16 μm. The use of the near-infrared band allows a better sensitivity to effective temperature, while minimizing the influence of the gravity and line blanketing on the angular diameter determinations (Di Benedetto 2005). SBCRs as functions of V, (V - K) have been proven to be practically independent on metallicity and they depend very little on the reddening (Thompson et al. 2001; Storm et al. 2004; Pietrzyński et al. 2019; Zgirski et al. 20241).
The IRSB technique for pulsating stars is derived from all these considerations and it has been applied in the analysis of classical Cepheids, in Gieren et al. (1997) and Gieren et al. (2018), among others, where the authors determined distances to individual pulsators and calibrated period-luminosity (PL) relations for them. More recently, we used the IRSB technique in the analysis of BL Her stars (Wielgórski et al. 2024) and RR Lyrae stars (Z24) in the solar neighborhood. It is a fully empirical approach to the BW method that relies on SBCR calibrations resulting from observations and it is independent of the stellar atmosphere models.
The parameter known as the p-factor, which is a ratio of the actual alteration of the stellar radii to the integral of the observed RV between given pulsation phases, is crucial in every calibration and application of the BW method. As described by Nardetto et al. (2007), p may be divided into different factors of a product, including the fact that the measured RV of a given part of the stellar surface is a projection of the pulsational velocity of the surface projected on the line of sight. Other components of the p-factor correspond to the ratio of gas velocity of the photosphere to that of the line forming region and the ratio of the pulsational to the gas velocity of the photosphere.
It is important to note that calibrations based on different applications of the BW method yield different values of the p-factor (Gieren et al. 2013). In order to avoid committing a systematic error in the distance estimation, it is thus pivotal to apply the method in exactly the same way as was done for its calibration. We can clearly see this comparing the analyses performed by us (Bras et al. 2024, Z24) for RR Lyrae stars from the solar neighborhood using the SPIPS (Mérand et al. 2015) code and the IRSB method. While we obtained similar scatters of p-factors (6%-7%) using both techniques, the mean values of p are systematically shifted between each other (with the mean value of p = 1.24 from SPIPS and p = 1.39-1.45 from IRSB, depending on a SBCR). It highlights that various applications of the method are sensitive to specific components of the p-factor in a different way.
According to a long-established view (Catelan & Smith 2015), RR Lyrae stars trace the old stellar population and allow distances to be determined to systems where young stellar distance indicators (e.g., classical Cepheids) are usually not present, such as dwarf spheroidal galaxies and globular clusters. Even though their picture of being exclusively members of the metalpoor Population II has been questioned in the literature (Bobrick et al. 2024; Zhang et al. 2025), there is no empirical proof for the hypothesis that a large part of the population of nearby RR Lyrae stars is made up of members of Population I with metallicities similar to solar (e.g., determinations for nearby RR Lyrae stars of Crestani et al. 2021 prove their low metallicity). Moreover, simulations of the evolution of metal-rich binaries performed by Karczmarek et al. (2017) showed that the contamination of regular RR Lyrae stars by metal-poor and low-mass Binary Evolution Pulsators (Pietrzyński et al. 2012), which imitate the RR Lyrae variability, is at the level of less than 1%. While distances based on RR Lyraes are typically determined using periodluminosity or period-metallicity relations (e.g., Bhardwaj et al. 2020; Zgirski et al. 2023; Narloch et al. 2024), the BW analysis provides an independent, though more observationally demanding, means of distance estimation for these stars. We made a broader review of the literature related to the BW method for RR Lyrae stars in the introduction to our calibration paper (Z24). In the context of this paper, it is important to mention the work of Jurcsik et al. (2017) that dealt with a task of BW distances to 26 RR Lyrae stars from M 3 based on the optical (V - 1) color and the stellar atmosphere models of Castelli & Kurucz (2003). In that work, a theoretical uniform value of p = 1.35 (Nardetto et al. 2004) computed for a model of the prototype classical Cepheid, δ Cep, was assumed. The authors reported a splendid scatter of individual stellar distances of 3%.
The goal of this work is to determine distances and mean radii of RR Lyrae stars from the globular cluster M 3 (NGC 5272). We used the previously calibrated IRSB technique and data available in the literature in order to verify the precision of the technique applied to a spatially confined system and investigate the period-radius (PR) relation for RR Lyraes from the cluster.
2 Data
We took optical light curves in the V band and RV curves from the previously mentioned work of Jurcsik et al. (2017) and the Ks band photometry of RR Lyrae stars in M 3 published by Bhardwaj et al. (2020) that is calibrated in the 2MASS system (Skrutskie et al. 2006). In order to minimize the impact of decoherence of periodic data having periods determined with finite precision, we used a temporally compact span of epochs for each observable2. While in the case of V and K magnitudes we used all the available data, radial velocities for M 3 RR Lyraes were obtained in two observing campaigns in 2000 and in 2012. These observations were performed using two different spectrographs. Observations from 2000 were gathered by Hydra installed on the 3.5 m WYIN telescope at the Kitt Peak National Observatory (Barden et al. 1994; Sandstrom et al. 2001), while in 2012 Hectoechelle installed on the 6.5 m MMT in Arizona (Szentgyorgyi et al. 2011) was used. Thus, assuming a typical pulsation period of an RR Lyrae in our sample of P = 0.6 d, the two observing campaigns are separated by more than 2600 pulsation cycles, while each observing campaign was completed in less than 80 typical pulsation cycles. We decided to use data from just one spectrograph, preferring the more precise RV measurements from Hectoechelle. However, in the case V 51, V 81, and V 84, these measurements did not have good enough coverage to construct a proper empirical model of the RV curve. In these cases, we only used the data from Hydra. We crossmatched data from the Jurcsik et al. (2017) and Bhardwaj et al. (2020) works and obtained datasets available for analysis using the IRSB technique for 14 RRab stars.
Coefficients of the p = a × (log P + 0.25) + b relation together with their uncertainties depending on a SBCR and resulting from the calibration work (Z24).
3 Calibration of the technique
In our previous work (Z24), we delivered empirical calibrations of the IRSB technique based on eight RRab stars in the solar vicinity; their accurate3 distances were determined by the Gaia mission (Gaia Collaboration 2021) for four different SBCRs. While there is no SBCR calibrated for RR Lyrae stars available in the literature, we compared p-factor values and mean radii resulting from the application of three SBCRs for dwarfs and subgiants (Kervella et al. 2004a; Graczyk et al. 2021, and Salsi et al. 2021 calibrated mean p-factor values of 1.44, 1.39, and 1.45, respectively) and one SBCR for classical Cepheids (Kervella et al. 2004b calibrated a mean of p = 1.40). We also found relations between p and the pulsation period (P) of RRab stars in our sample. Even though our calibrating sample is not large and the obtained uncertainties of relations between log P and p are considerable, our technique-specific calibration is fully empirical, based on very good-quality data and the state-of-the-art accurate Gaia parallaxes of RR Lyraes being closer than 1.5 kpc from the Sun. The calibration gives an advantage over the p values previously assumed in many applications of the BW method, including for RR Lyrae stars.
In the original calibration paper (Z24), we provided explicit parameters of only two extreme p(P) relations. Table 1 provides the parameters of these relations and derived mean p-factors for all considered SBCRs and the two considered types of linear fit4. In Table 1, we also give an additional calibration based on the recent SBCR of Bailleul et al. (2025) for classical Cepheids, which is not included in the Z24 paper. In the original work, we only gave the parameters of the linear relations between the angular diameter and the integral of radial velocities based on the bisector fit. We additionally provide the relation parameters based on the least-squares (LS) fit in the same Table 1.
4 Application of the technique
We provide a detailed description of the technique we apply in Z24. In order to phase the data, we adopt pulsation periods of M 3 RR Lyraes from the Jurcsik et al. (2012) paper. We fit Akima splines (Akima 1970) to the V light curve and the RV curve. Then, we calculate (V - K) color5 for epochs corresponding to the measured K band magnitudes. After doing that, we perform SBCR-based estimations of the angular diameters for those epochs where the V band magnitude is interpolated using the spline model. The K band light curve is always treated as a collection of discrete measurements, except when used to estimate the scatter of K band magnitudes. For this task, we fit the amplitudes and zero points of the Fourier series-based templates published by Braga et al. (2019), and calculate the scatter of measurements around the fit.
Essentially, our approach comes down to the linear fit of the following relation:
 (1)
(1)
Here θ is the angular diameter, and ![Mathematical equation: $x(\phi)=-2 \int_{0}^{\phi} [v_r(\phi') -v_{r,0}] d \phi'$](/articles/aa/full_html/2026/02/aa56144-25/aa56144-25-eq2.png) is the integral of RV curve (vr being the measured RV; vr,0 being the mean systemic RV) over the pulsation phase φ. The fitted slope is a product of the p-factor and the stellar parallax (w), while the intercept corresponds to the angular diameter for φ = 0 defined as the phase of maximum brightness in the V band. In our analysis, we consider two types of linear fits to the above relation: the bisector method (Isobe et al. 1990) and the LS fit. In this paper we report the results based on these two types of estimations.
is the integral of RV curve (vr being the measured RV; vr,0 being the mean systemic RV) over the pulsation phase φ. The fitted slope is a product of the p-factor and the stellar parallax (w), while the intercept corresponds to the angular diameter for φ = 0 defined as the phase of maximum brightness in the V band. In our analysis, we consider two types of linear fits to the above relation: the bisector method (Isobe et al. 1990) and the LS fit. In this paper we report the results based on these two types of estimations.
While in the Z24 paper we assumed ϖ from Gaia in order to calibrate p, in the current work we apply SBCR-specific log P-p (Pp) relations in order to derive the distance r = 1/ϖ. Additionally, we determine mean radii of the studied RR Lyraes from M 3:
![Mathematical equation: \langle R\rangle=\frac{\langle r \rangle \theta_0}{2}+ \langle \Delta R \rangle = \frac{\langle r \rangle \theta_0}{2} - \langle r \rangle p \varpi \int\displaylimits_0^1{\int\displaylimits_{0}^{\phi}{\left[v_r(\phi')-v_{r,0}\right]d \phi'} d \phi},](/articles/aa/full_html/2026/02/aa56144-25/aa56144-25-eq3.png) (2)
(2)
where 〈r〉 is the mean distance to stars in our sample that is generally SBCR-dependent. The above equation follows directly from Equation (6) in Z24. Here the mean stellar radii of individual stars depend on the cluster distance, previously estimated as the mean of the individual stellar distances, 〈r〉 = 1/ϖ, and the linear fit slope pϖ is written explicitly. This approach allows us to obtain better precision of the stellar radii determinations. The derivation of the mean radii following Equation (2) relies on parameters of the θ(x) relation (Equation (1)). In this formulation, it does not depend directly on the p-factor.
The pulsation periods adopted from Jurcsik et al. (2012) provide good phasing of the data. However, the periods are short, were never determined with infinite precision, and are drifting slowly with time (characteristic for RR Lyrae variables), which causes decoherence between batches of datasets that were taken at time-separated epochs, differing by many pulsation periods between each other. In order to account for that decoherence, we independently estimated ∆φV-K and ∆φRV-K values that correspond to the phase shift between the V, K light curves and between the RV curve and K light curve, respectively. Specifically, we probed the space of the aforementioned phase shifts and corresponding scatter around the bisector fit to the relation from the Equation (1) with the two independent phase steps of 0.002. The phase shifts that yield the smallest scatter of points around the fitted relation between the angular diameter and the integral of radial velocities provide the adopted ∆φV-K and ∆φRV-K values. The adoption of the pulsation period change rates published by Jurcsik et al. (2012) does not yield proper coherence of the empirical curves in some cases. When using period change rates determined for stars in our sample, we generally obtained phase shifts that resulted in an incorrect correspondence between angular diameters and integrals of RV curves, and between different empirical curves (V, K, RV). In a more general context of the used technique, the development of the independent phase shift determination is more robust as it allows us to apply the method to stars that do not have a long history of observations that could allow for the analysis of their period changes. Our approach also follows the reasoning present in the previous works devoted to the IRSB technique (such as Gieren et al. 1997), where the authors determined phase shifts based on the minimization of the scatter around the relation between the stellar angular diameter and the integral of the RV curve.
5 Analysis and results
In this paper, we present the plots related to the analysis of the variable V 19 based on the SBCR of Kervella et al. (2004a). The collection of plots corresponding to all the stars in our sample and all five applied SBCRs are available on Zenodo. All the plots present the data and results where phase shifts between observables have already been applied. Figure 1 presents the light and RV curves for V 19 together with the Akima splines modeling the variation in the RV and V band magnitudes; the model for the V magnitude is not visible due to the dense coverage of the light curve. The bottom panel of the plot depicts the K band light curve with the template fit represented by a dashed curve.
Table A.1 presents the estimated values of the ∆φV-K and ∆φRV-K phase shifts together with the pϖ products and the corresponding fit uncertainties for all the studied objects, depending on the used SBCR. We might see that the formal fit uncertainties are significantly larger for the LS fit. Figure 2 presents the course of the integral of the RV curve (upper panel) and the course of the angular diameter curve together with θ estimations for specific phases (lower panel). Figure 3 depicts the bisector fit between the two variables. The slope of the line depends most strongly on the extreme values of θ and x. Thus, it is important to have well-probed minima and maxima in Figure 2 that estimate accurately the amplitudes of size variations6. Otherwise, we must rely on the extrapolation of the position of an extremum. In the case of three stars - V 55, V 81, and V 83, we are dealing with large gaps in their coverage of the K band light curves. This results in the lack of the estimation of θ near the maximum size. We still decided to keep these objects in our sample as they have parts of their K band light curves, including those corresponding to the minimal stellar size, relatively well-covered.
We performed distance determinations for individual stars in our sample through the calculation of the  ratio where the numerator is the value of the p-factor for a given stellar pulsation period resulting from the calibration work (Z24) and the denominator is the slope of the fitted θ(x) relation. Table B.1 summarizes determinations of distances for all stars in the sample together with mean distances and the corresponding standard errors, depending on a SBCR and a fitting method.
We propagated the uncertainties of the derived distances and mean stellar radii using Monte Carlo simulations where we included the following error components: scatter of radial velocities and V magnitudes around interpolating Akima splines, scatter of K magnitudes around fitted templates, and the uncertainty of the p-factor for a given pulsation period (Table 1). The systematic uncertainty components include the V and K magnitude uncertainties of photometric zero points (0.01 mag), and the formal systematic uncertainty of E(B - V) reddening assumed as 0.01 mag, even though the reddening for M 3 is extremely small, E(B - V) = 0.014 mag (Jurcsik et al. 2017; Harris 1996). The impact of reddening on the slope of the θ(x) relation is also known to be very small compared to other factors of the total uncertainty (Z24). In the case of mean radius uncertainties, the variation in the previously determined mean cluster distance was performed instead of the variation in the p-factor value in order to estimate one of the components of the systematic uncertainty.
The largely dominating component of distance uncertainties results from the scatter of the K band photometry, which in the case of the used data corresponds to around 0.02 mag. In the case of V 19, the SBCR of Graczyk et al. (2021) and the bisector fit yield the total simulated distance distribution rms of 870 pc. The scatter of the K magnitude measurements propagates into 830 pc of the total statistical distance error. The component associated with the uncertainty of the p-factor is significantly smaller (250 pc), while the other components are negligible.
In our simulated distributions of pϖ based on the bisector fit, we observe a bias between the directly calculated slope and the median (mean, mode) of the simulated distribution. We do not observe this bias when using the LS fit. Figures 4 and 5 depict the fits and distributions of pϖ resulting from Monte Carlo (MC) simulations; the black points and lines correspond to the actual determination. The black vertical line in the lower panel corresponds to the measurement based on the original unvaried data. The bisector bias is not that apparent in the calibration work (Z24) as the Gaia parallax uncertainty yields an error component of the derived p-factor that is similar to the component corresponding to the K band magnitude scatter.
However, the LS fit yields results that are less stable than those obtained based on the bisector. The spread of the simulated distributions is larger, resulting in larger statistical uncertainties. We obtain the scatter of individual stellar distances of 7% for the bisector and 7.5% for the LS fit. The mean rms of the simulated distributions corresponding to individual distance measurements is at the level of 6.5% and 8% of the distance for the bisector and for the LS estimator, respectively.
Since the original calibration work (Z24) was based on the bisector fit and due to the better stability of the solution, we still relied on the slope of the bisector fit as the basis of the preferred estimator of distance. Specifically, when calculating the M 3 distance, we relied on the average of the five mean bisectorbased distances for the all used SBCRs with the mean of the corresponding standard errors being the statistical uncertainty of our estimation (0.19 kpc). The shift between mean cluster distances based on the bisector and the unbiased LS fit (≈50 pc, i.e., 0.5%) serves as the estimation of a component of the systematic uncertainty of the distance determination to M 3. As we can see in Table B.1, the maximum observed distance shift resulting from the choice of SBCR is on the order of ≈110 pc, i.e., 1.1% in the case of the bisector. The component of the systematic distance uncertainty associated with photometric zero points is on the order of 0.9% and the component associated with the uncertainty of the E(B - V) reddening is on the order of 0.4% of the estimated cluster distance. In total, these factors constitute the mean total systematic distance uncertainty of 2.9%. Finally, our estimation of the M 3 distance is
 (3)
(3)
which corresponds to the true distance modulus of μ0,M3 = (15.015 ± 0.041 ± 0.063) mag. The statistical uncertainty of 0.19 kpc corresponds to the standard deviation of individual distances of 0.71 kpc for our sample of 14 stars.
Figure 6 depicts the M 3 distance together with individual stellar distances resulting from the SBCR of Kervella et al. (2004a). They are compared with some of the recent M 3 distances available in the literature. The above-mentioned work of Jurcsik et al. (2017), which is also the source of optical photometry and radial velocities used in this work, yielded rM3 = 10.48 ± 0.21 kpc. In their compilation of Galactic cluster distances, Baumgardt & Vasiliev (2021) report, among other values, the Gaia EDR3 kinematic distance to M 3, rM3 = 10.116 ± 0.384 kpc and a distance that is a mean of 38 literature determinations, rM3 = 10.175 kpc. The paper of Bhardwaj et al. (2020), which is also a source of the near-infrared photometry utilized in this work, presents a distance to M 3 based on the PL relations for RR Lyrae stars. Originally, the authors reported the true distance modulus of μ0,m3 = (15.041 ± 0.017 ± 0.036) mag based on the theoretical zero points for JHKs bands from the work of Marconi et al. (2015). They additionally present distance estimations based on the empirical zero points of Muraveva et al. (2018) based on Gaia DR2 parallaxes, μ0,M3 = (15.001 ± 0.098 ± 0.121) mag. We used the coefficients of the PL relations reported in Bhardwaj et al. (2020) and our sample of nearby Galactic RR Lyrae stars from Zgirski et al. (2023), which had their absolute magnitudes determined based on Gaia DR3 parallaxes. We obtained M 3 true distance moduli (with statistical errors) of
  = (14.973 ± 0.034) mag and
  = (14.955 ± 0.027) mag for the J and K band, respectively. All of the above results are in agreement with the distance determination to M 3 in the current work.
Based on Equation (2), we also determined the mean radii of M 3 RR Lyraes in our sample. Table C.1 contains the results of these determinations for all considered SBCRs and the two estimation types. Considering the bisector estimator of θ(x), Table 3 presents the coefficients of the fitted PR relations, and Figure 7 depicts the (log P-log R) plot for the SBCR of Kervella et al. (2004a), a fitted linear relation, and three literature PR relations of Bras et al. (2024), Z24, and Marconi et al. (2015).
For all the considered SBCRs we obtain a remarkably low scatter around the fitted PR relation that corresponds to the relative precision of the radius estimation of around 0.5%. The relevant components of the systematic uncertainty of the determined mean stellar radii are associated with the uncertainty of the parallax (distance), the photometric zero points, and the E(B - V) reddening. Propagating the 0.01 mag V, K zero point and E(B - V) errors, we obtain the corresponding components of the systematic uncertainty of mean stellar radii of 0.01 R⊙, 0.035 R⊙, and 0.016 R⊙, respectively. The 0.2 kpc error of the cluster distance corresponds to the systematic mean radius uncertainty of 0.11 R⊙. In total, we estimate the total systematic uncertainty of the mean stellar radii of 0.17 R⊙, i.e., around 3% of the typical radius of RR Lyrae star.
We note a splendid agreement of our PR relations with the theoretical Marconi et al. (2015) PR relation, much better than for the PR relations for RR Lyrae stars from the solar neighborhood of Bras et al. (2024) and Z24 that were based on Gaia DR3 parallaxes. Marconi et al. (2015) reports the following relation for RRab stars: log (〈R〉/R⊙) = (0.55 ± 0.02) log P + 0.866 ± 0.003. Taking the pivot log P0 = −0.25, as in our relation, the intercept of that relation corresponds to b = 0.729. That relation is in especially good agreement with our PR relations resulting from the SBCR of Bailleul et al. (2025) for classical Cepheids, log (〈R〉/R⊙) = (0.552 ± 0.026) (log P + 0.25) + 0.7268 ± 0.0014 and log (〈R〉/R⊙) = (0.555 ± 0.027)(log P + 0.25) + 0.7288 ± 0.0014 for the bisector and the LS fit of parameters of the θ(x) relation, respectively.
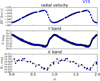 |
Fig. 1 Light and RV curves for V 19 phased with zero points of the phase determined in this work. The plots corresponding to all the stars in our sample are available on Zenodo. |
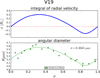 |
Fig. 2 Top: integral of the RV curve. Bottom: course of the angular diameter based on one of the five used SBCRs for V 19. The curve in the bottom panel is not a fit, but the curve from the top scaled by 2pϖ. The slope results from the bisector fit. The plots corresponding to all stars and all assumed SBCRs are available on Zenodo. |
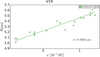 |
Fig. 3 Linear bisector fit of a relation between the integral of RV and the angular diameter for V 19. The plots corresponding to all stars and all assumed SBCRs are available on Zenodo. |
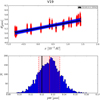 |
Fig. 4 Top: bisector fits to MC-simulated data. Bottom: corresponding distribution of fitted slopes, pϖ products, for V 19 together with marked 1σ confidence interval. The distributions corresponding to all stars and all assumed SBCRs are available on Zenodo. |
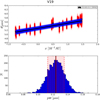 |
Fig. 5 Top: least-squares fits to MC-simulated data. Bottom: corresponding distribution of fitted slopes, pϖ products, for V 19 together with marked 1σ confidence interval. The distributions corresponding to all stars and all assumed SBCRs are available on Zenodo. |
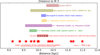 |
Fig. 6 Comparison of distances to M 3 within their statistical uncertainties from the literature with the result from this work for the SBCR of Kervella et al. (2004a) and the bisector fit. The plots corresponding to all assumed SBCRs are available on Zenodo. |
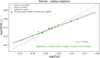 |
Fig. 7 Period-radius relation derived in this work based on the SBCR of Kervella et al. (2004a) and the bisector fit compared with the theoretical relation of Marconi et al. (2015) and the two relations derived for RR Lyrae stars from the solar neighborhood. The plots corresponding to all assumed SBCRs are available on Zenodo. |
6 Discussion and conclusions
In this work, we obtained individual distances and mean radii for 14 RR Lyraes in M 3, as well as the estimation of the mean distance to the cluster based on the data available in the literature. Our determinations are based on a calibration dedicated to exactly the same fully empirical application of the method, which is crucial given the fact that any p-factor calibration is also application-dependent and distance scales as r ∝ p given a pϖ solution. We report a scatter of individual stellar distances of around 7%. According to our Monte Carlo simulations of the error propagation, the component of the statistical uncertainty of an individual distance determination that is related to the scatter of the K band photometry is overwhelmingly large compared to other sources of the total statistical uncertainty. The size of the M 3 system itself is on the order of 100 pc (Brosche et al. 1999), which corresponds to 1% of the cluster’s distance. We obtained a statistical uncertainty of the cluster distance calculated as a standard error of the mean of individual distances of around 2%. We applied the same five SBCRs in the calibration and in the determinations performed for the purpose of this work, with the recent SBCR calibration (Bailleul et al. 2025) for classical Cepheids based on the optical photometry included for the first time in our IRSB analysis.
We found that the slope of bisector line corresponding to the estimation of the pϖ product is a biased estimator through the Monte Carlo simulations yielding possible values of derived individual stellar distances. This is possibly associated with the uncertainties of the angular diameter estimation being significantly larger than uncertainties of the integral of the RV curve. The slope resulting from the LS fitting of a line is not biased, but more unstable, yielding larger scatter and statistical uncertainty than the one resulting from the bisector fit. We estimated the systematic distance uncertainty of 290 pc - 2.9% through the comparison of the estimation based on the bisector fit with the result yielding from LS (0.5%; no significant offset between distances resulting from the two types of estimators is observed), the choice of SBCR (1.1% in the case of the preferred bisector fit), the photometric zero points uncertainty (up to 0.9%), and the uncertainty of the E(B - V) reddening (0.4%). By deriving the LS distance based on the bisector calibration of the method, we would obtain a systematic mean distance increase relative to the bisector distance of 5% instead of 0.5%. It again shows that any determination should closely follow the same recipe as the calibration of the method. Even though the calibration based on the LS provided in Table 1 is of lower quality than the calibration based on the bisector, it is the proper calibration for any determination of distance based on the LS version of the technique.
We also performed an exercise of the distance determination assuming constant value of p for a given SBCR and fitting method. The average p values based on the calibration work are available in the last column of Table 1. A summary of this analysis is given in Table 2. The uncertainty of the mean distance with the assumption of the uniform p value for a given SBCR and a fitting method is almost the same as that resulting from the assumption of a linear Pp relation. The mean distances based on the p independent of the pulsation period are on average slightly smaller than values resulting from Pp relations by 0.5% and 0.2% for the bisector and the LS versions of the technique, respectively.
We generally obtained good agreement within the statistical uncertainties with the other distance determinations to M 3 that are available in the literature. Regarding the determination based on the semi-empirical application of the Baade-Wesselink method (Jurcsik et al. 2017), the authors obtained a value that is in agreement with the distance obtained in this work, but with the expected value of the mean distance that is about 4% larger, 〈r〉 = 10.48 ± 0.21 kpc. The determination is tied to the p = 1.35, which is the value adopted from the Nardetto et al. (2004) modeling of δ Cep, the prototype classical Cepheid. However, in the original work of Nardetto et al. (2004), the authors claim that in the case of broadband interferometric observations, the value of p = 1.27 should be used instead as it is associated with the pulsation velocity related to the continuum of the photosphere. Assuming a constant pϖ solution, the corresponding scaling would bring the mean M 3 distance reported in the Jurcsik et al. (2017) work to the value of 〈r〉 = 9.86 kpc, which is slightly closer to the mean M 3 distance we obtained in this work.
We obtained very precise radii determinations when assuming uniform M 3 distance with the rms of the fitted relations corresponding to around 0.5% of a stellar radius. We observed much better agreement of PR relations with the theoretical prediction of Marconi et al. (2015) than in the case of determinations based on the Gaia DR3 parallaxes of individual RR Lyrae stars from the solar neighborhood (Bras et al. 2024, Z24). We estimated the systematic uncertainty of the determined mean stellar radii of 0.17R⊙ with its largest component (0.11 R⊙) being associated with the assumed cluster distance error of 2%. In this context, the aforementioned remarkable agreement with the theoretical prediction of the PR relation is a good independent check of the accuracy of our mean cluster distance determination as a slight error in the assumed distance yields a relatively substantial systematic shift of values of the determined radii. This means that the assumption of the cluster distance larger by 0.5 kpc, for example, would systematically raise the determined radii by 0.27 R⊙. It would make our empirical PR relation derived in this work less compatible with the relation of Marconi et al. (2015). Our Zenodo archive includes PR relations based on 〈r〉 distances larger by 0.5 kpc than determined in this work.
The IRSB technique is demanding observationally, but fully empirical and independent of other distance indicators, including the PL relations for different species of pulsating stars. One of its biggest advantages is the weak dependence on the reddening and metallicity. High precision of the used data is of crucial importance. In particular, the low scatter of the infrared photometric measurements around the corresponding light curve could allow for the mitigation of the statistical uncertainties of individual stellar distances. In the future, we aim to utilize the technique in the determinations of distances to more systems, such as globular clusters or dwarf spheroidal galaxies in the vicinity of the Milky Way. In the context of the cosmic distance ladder, the technique applied to RR Lyrae stars and Type II Cepheids might allow us to determine benchmark distances to older stellar systems and yield an independent calibration of the tip of the red-giant branch (TRGB) method that allows us to reach supernova host galaxies. The biggest range limitation in the case of RR Lyrae stars is the spectroscopy. RR Lyraes in the Local Group galaxies are already faint7, which makes it challenging to obtain their RV curves based on precise measurements. However, with the advent of the new instruments with bigger apertures, farther targets will be achievable with this the method. Classical Cepheids remain the most important pulsating stellar distance indicators that allow us to reach much farther, but the calibration of the Baade-Wesselink method for them is a complicated and open issue (Trahin et al. 2021), at least when it comes to determining distances to individual stars. In addition, the calibration of distance determination methods based on RR Lyrae stars is a pivotal task for the study of the previously mentioned systems where classical Cepheids are not present. We expect to perform new refined calibrations of the technique based on the updated Gaia parallaxes and more photometric and spectroscopic measurements of different types of pulsating stars from the solar neighborhood in the future.
Coefficients of the log (〈R〉/R⊙) = a × (log P + 0.25) + b relation together with their uncertainties and the rms scatter around the fitted relation obtained in this work depending on the SBCR.
Data availability
The collection of plots corresponding to all stars in our sample and all five applied SBCRs is available on Zenodo under the following link: https://zenodo.org/records/17613276.
Acknowledgements
The research leading to these results has received funding from the European Research Council (ERC) under the European Union’s Horizon 2020 research and innovation program (grant agreement No. 951549). NN, WG, GP, AG and PK acknowledge the support of the French Agence Nationale de la Recherche (ANR), under grant ANR-23-CE31-0009-01 (Unlock-pfactor). AG acknowledges the support of the Agencia Nacional de Investigación Científica y Desarrollo (ANID) through the FONDECYT Regular grant 1241073. We thank the anonymous referee for their thorough insight that particularly helped us improving the structure and legibility of the manuscript.
References
- Akima, H. 1970, J. ACM, 17, 589 [Google Scholar]
- Baade, W. 1926, Astron. Nachr., 228, 359 [NASA ADS] [CrossRef] [Google Scholar]
- Bailleul, M. C., Nardetto, N., Hocdé, V., et al. 2025, A&A, 698, A46 [NASA ADS] [CrossRef] [EDP Sciences] [Google Scholar]
- Baumgardt, H., & Vasiliev, E. 2021, MNRAS, 505, 5957 [NASA ADS] [CrossRef] [Google Scholar]
- Barden, S. C., Armandroff, T., Muller, G., et al. 1994, SPIE, 2198, 87 [Google Scholar]
- Barnes, T. G., & Evans, D. S. 1976, MNRAS, 174, 489 [Google Scholar]
- Bhardwaj, A., Rejkuba, M., de Grijs, R., et al. 2020, AJ, 160, 220 [NASA ADS] [CrossRef] [Google Scholar]
- Bobrick, A., Iorio, G., Belokurov, V., et al. 2024, MNRAS, 527, 12196 [Google Scholar]
- Braga, V. F., Stetson, P. B., Bono, G., et al. 2019, A&A, 625, A1 [NASA ADS] [CrossRef] [EDP Sciences] [Google Scholar]
- Bras, G., Kervella, P., Trahin, B., et al. 2024, A&A, 684, A126 [NASA ADS] [CrossRef] [EDP Sciences] [Google Scholar]
- Brosche, P., Odenkirchen, M., & Geffert, M. 1999, NewA, 4, 133 [Google Scholar]
- Catelan, M., & Smith, H. A. 2015, Pulsating Stars (Wiley-VCH) [Google Scholar]
- Castelli, F., & Kurucz R. L. 2003, New Grids of ATLAS9 Model Atmospheres, eds. N. Piskunov, W. W. Weiss, & D. F. Gray, IAU Symp., 210, 20 [NASA ADS] [Google Scholar]
- Crestani, J., Braga, V. F., Fabrizio, M., et al. 2021, ApJ, 914, 10 [NASA ADS] [CrossRef] [Google Scholar]
- Di Benedetto, G. P. 2005, MNRAS, 357, 174 [NASA ADS] [CrossRef] [Google Scholar]
- Fouqué, & Gieren 1997, A&A, 320, 799 [Google Scholar]
- Gaia Collaboration (Brown, A. G. A., et al.) 2021, A&A, 649, A1 [NASA ADS] [CrossRef] [EDP Sciences] [Google Scholar]
- Gieren, W., Fouqué, P., & Gómez, M. 1997, ApJ, 488, 74 [NASA ADS] [CrossRef] [Google Scholar]
- Gieren, W., Fouqué, P., & Gómez, M. 1998, ApJ, 496, 17 [NASA ADS] [CrossRef] [Google Scholar]
- Gieren, W., Storm, J., Nardetto, N., et al. 2013, IAU Symp., 289, 138 [NASA ADS] [Google Scholar]
- Gieren, W., Storm, J., Konorski, P., et al. 2018, A&A, 620, A99 [NASA ADS] [CrossRef] [EDP Sciences] [Google Scholar]
- Graczyk, D., Pietrzyński, G., Thompson, I. B., et al. 2020, ApJ, 904, 13 [Google Scholar]
- Graczyk, D., Pietrzyński, G., Galan, C., et al. 2021, A&A, 649, A109 [NASA ADS] [CrossRef] [EDP Sciences] [Google Scholar]
- Graczyk, D., Pietrzyński, G., Galan, C., et al. 2025, A&A, 694, A65 [NASA ADS] [CrossRef] [EDP Sciences] [Google Scholar]
- Harris W. E. 1996, AJ, 112, 1487 [NASA ADS] [CrossRef] [Google Scholar]
- Isobe, T., Feigelson, E. D., Akritas, M. G., & Babu, G. J. 1990, ApJ, 364, 104 [Google Scholar]
- Jurcsik, J., Smitola, P., Hajdu, G., et al. 2017, MNRAS, 468, 1317 [NASA ADS] [CrossRef] [Google Scholar]
- Jurcsik, J., Hajdu, G., Szeidl, B., et al. 2012, MNRAS, 419, 2173 [NASA ADS] [CrossRef] [Google Scholar]
- Karczmarek, P., Wiktorowicz, G., Ilkiewicz, K., et al. 2017, MNRAS, 466, 2842 [CrossRef] [Google Scholar]
- Kervella, P., Thévenin, F., Di Folco, E., & Ségransan, D. 2004a, A&A, 426, 297 [NASA ADS] [CrossRef] [EDP Sciences] [Google Scholar]
- Kervella, P., Bersier, D., Mourard, D., et al. 2004b, A&A, 428, 587 [NASA ADS] [CrossRef] [EDP Sciences] [Google Scholar]
- Koen, C., Marang, F., Kilkenny, D., & Jacobs, C. 2007, MNRAS, 380, 1433 [NASA ADS] [CrossRef] [Google Scholar]
- Marconi, M., Coppola, G., Bono, G., et al. 2015, ApJ, 808, 50 [Google Scholar]
- Mérand, A., Kervella, P., Breitfelder, J., et al. 2015, A&A, 584, A80 [NASA ADS] [CrossRef] [EDP Sciences] [Google Scholar]
- Muraveva, T., Delgado, H. E., Clementini, G., et al. 2018, MNRAS, 481, 1195 [CrossRef] [Google Scholar]
- Nardetto, N., Fokin, A., Mourard, D., et al. 2004, A&A, 428, 131 [CrossRef] [EDP Sciences] [Google Scholar]
- Nardetto, N., Mourard, D., Mathias, Ph., et al. 2007, ApJ, 471, 661 [Google Scholar]
- Narloch, W., Hajdu, G., Pietrzyński, G., et al. 2024, A&A, 689, A138 [NASA ADS] [CrossRef] [EDP Sciences] [Google Scholar]
- Pietrzyński, G., Thompson, I. B., Gieren, W., et al. 2012, Nature, 484, 75 [CrossRef] [Google Scholar]
- Pietrzyński, G., Graczyk, D., Gallenne, A., et al. 2019, Nature, 567, 200 [Google Scholar]
- Salsi, A., Nardetto, N., Mourard, D., et al. 2021, A&A, 652, A26 [NASA ADS] [CrossRef] [EDP Sciences] [Google Scholar]
- Sandstrom, K., Pilachowski, C. A., & Saha, A. 2001, AJ, 122, 3212 [Google Scholar]
- Skrutskie, M. F., Cutri, R. M., Stiening, R., et al. 2006, AJ, 131, 1163 [NASA ADS] [CrossRef] [Google Scholar]
- Storm, J., Carney, B. W., Gieren, W., et al. 2004, A&A, 415, 531 [NASA ADS] [CrossRef] [EDP Sciences] [Google Scholar]
- Storm, J., Gieren, W., Fouqué, P., et al. 2011, A&A, 534, A94 [CrossRef] [EDP Sciences] [Google Scholar]
- Szentgyorgyi, A., Furesz, G., Cheimets, P., et al. 2011, PASP, 123, 1188 [Google Scholar]
- Thompson, I. B., Kałużny, J., Pych, W., et al. 2001, AJ, 121, 3089 [NASA ADS] [CrossRef] [Google Scholar]
- Trahin, B., Breuval, L., Kervella, P., et al. 2021, A&A, 656, A102 [NASA ADS] [CrossRef] [EDP Sciences] [Google Scholar]
- Welch, D. L. 1994, AJ, 108, 1421 [NASA ADS] [CrossRef] [Google Scholar]
- Wesselink, A. J. 1946, Bull. Astron. Inst. Netherlands, 10, 91 [Google Scholar]
- Wielgórski, P., Pietrzyński, G., Gieren, W., et al. 2024, A&A, 689, A241 [NASA ADS] [CrossRef] [EDP Sciences] [Google Scholar]
- Zhang, H., Iorio, G., Belokurov, V., et al. 2025, MNRAS, staf1789 [Google Scholar]
- Zgirski, B., Pietrzyński, G., Górski, M., et al. 2023, ApJ, 951, 114 [NASA ADS] [CrossRef] [Google Scholar]
- Zgirski, B., Gieren, W., Pietrzyński, G., et al. 2024, A&A, 690, A295 [NASA ADS] [CrossRef] [EDP Sciences] [Google Scholar]
That work devoted to the calibration of the IRSB technique for RR Lyrae stars is cited here as Z24.
By the term “observable”, we mean V, K magnitudes and RV measurements.
As shown in Zgirski et al. (2023), the near-infrared absolute magnitudes of nearby RR Lyrae stars (r < 1.5 kpc) obtained based on Gaia DR3 parallaxes are coherent with the photometry of these stars located in the LMC and the accurate distance to that galaxy based on detached eclipsing binaries (Pietrzyński et al. 2019). However, we observed a zero point offset between our PL relations and those found in the literature that are based on more distant stars and the same source of parallaxes.
In the original calibration work (Z24), we only provided the calibration based on the bisector fit. We report the calibration resulting from the LS fit and based on the same sample as in the Z24 for the first time here.
The SBCR of Salsi et al. (2021) and Graczyk et al. (2021) have already been calibrated for the 2MASS Ks band. However, when applying the SBCRs of Kervella et al. (2004a, 2004b), we had to transform the Ks band photometry into SAAO K magnitudes using the transformation equations given in the work of Koen et al. (2007), just as we did in Z24. In this sense, the (V - K) correponds here to the color that an applied SBCR is based on, with the 2MASS Ks being one of the possible calibrations of the 2 μm K magnitude.
RR Lyraes in the LMC have magnitudes V ≈ 19 mag.
Appendix A Values of the derived pϖ product
Values of the pϖ product resulting from bisector fit and LS fit together with phase shifts between different observables determined for all stars analyzed in this work.
Appendix B Individual stellar distances
Individual stellar distances together with the mean distances and the corresponding statistical uncertainties depending on a SBCR obtained in this work.
Appendix C Mean stellar radii
Mean stellar radii and their statistical uncertainties obtained in this work.
All Tables
Coefficients of the p = a × (log P + 0.25) + b relation together with their uncertainties depending on a SBCR and resulting from the calibration work (Z24).
Coefficients of the log (〈R〉/R⊙) = a × (log P + 0.25) + b relation together with their uncertainties and the rms scatter around the fitted relation obtained in this work depending on the SBCR.
Values of the pϖ product resulting from bisector fit and LS fit together with phase shifts between different observables determined for all stars analyzed in this work.
Individual stellar distances together with the mean distances and the corresponding statistical uncertainties depending on a SBCR obtained in this work.
All Figures
|
Fig. 1 Light and RV curves for V 19 phased with zero points of the phase determined in this work. The plots corresponding to all the stars in our sample are available on Zenodo. |
| In the text | |
|
Fig. 2 Top: integral of the RV curve. Bottom: course of the angular diameter based on one of the five used SBCRs for V 19. The curve in the bottom panel is not a fit, but the curve from the top scaled by 2pϖ. The slope results from the bisector fit. The plots corresponding to all stars and all assumed SBCRs are available on Zenodo. |
| In the text | |
|
Fig. 3 Linear bisector fit of a relation between the integral of RV and the angular diameter for V 19. The plots corresponding to all stars and all assumed SBCRs are available on Zenodo. |
| In the text | |
|
Fig. 4 Top: bisector fits to MC-simulated data. Bottom: corresponding distribution of fitted slopes, pϖ products, for V 19 together with marked 1σ confidence interval. The distributions corresponding to all stars and all assumed SBCRs are available on Zenodo. |
| In the text | |
|
Fig. 5 Top: least-squares fits to MC-simulated data. Bottom: corresponding distribution of fitted slopes, pϖ products, for V 19 together with marked 1σ confidence interval. The distributions corresponding to all stars and all assumed SBCRs are available on Zenodo. |
| In the text | |
|
Fig. 6 Comparison of distances to M 3 within their statistical uncertainties from the literature with the result from this work for the SBCR of Kervella et al. (2004a) and the bisector fit. The plots corresponding to all assumed SBCRs are available on Zenodo. |
| In the text | |
|
Fig. 7 Period-radius relation derived in this work based on the SBCR of Kervella et al. (2004a) and the bisector fit compared with the theoretical relation of Marconi et al. (2015) and the two relations derived for RR Lyrae stars from the solar neighborhood. The plots corresponding to all assumed SBCRs are available on Zenodo. |
| In the text | |
Current usage metrics show cumulative count of Article Views (full-text article views including HTML views, PDF and ePub downloads, according to the available data) and Abstracts Views on Vision4Press platform.
Data correspond to usage on the plateform after 2015. The current usage metrics is available 48-96 hours after online publication and is updated daily on week days.
Initial download of the metrics may take a while.