Open Access
Fig. 4
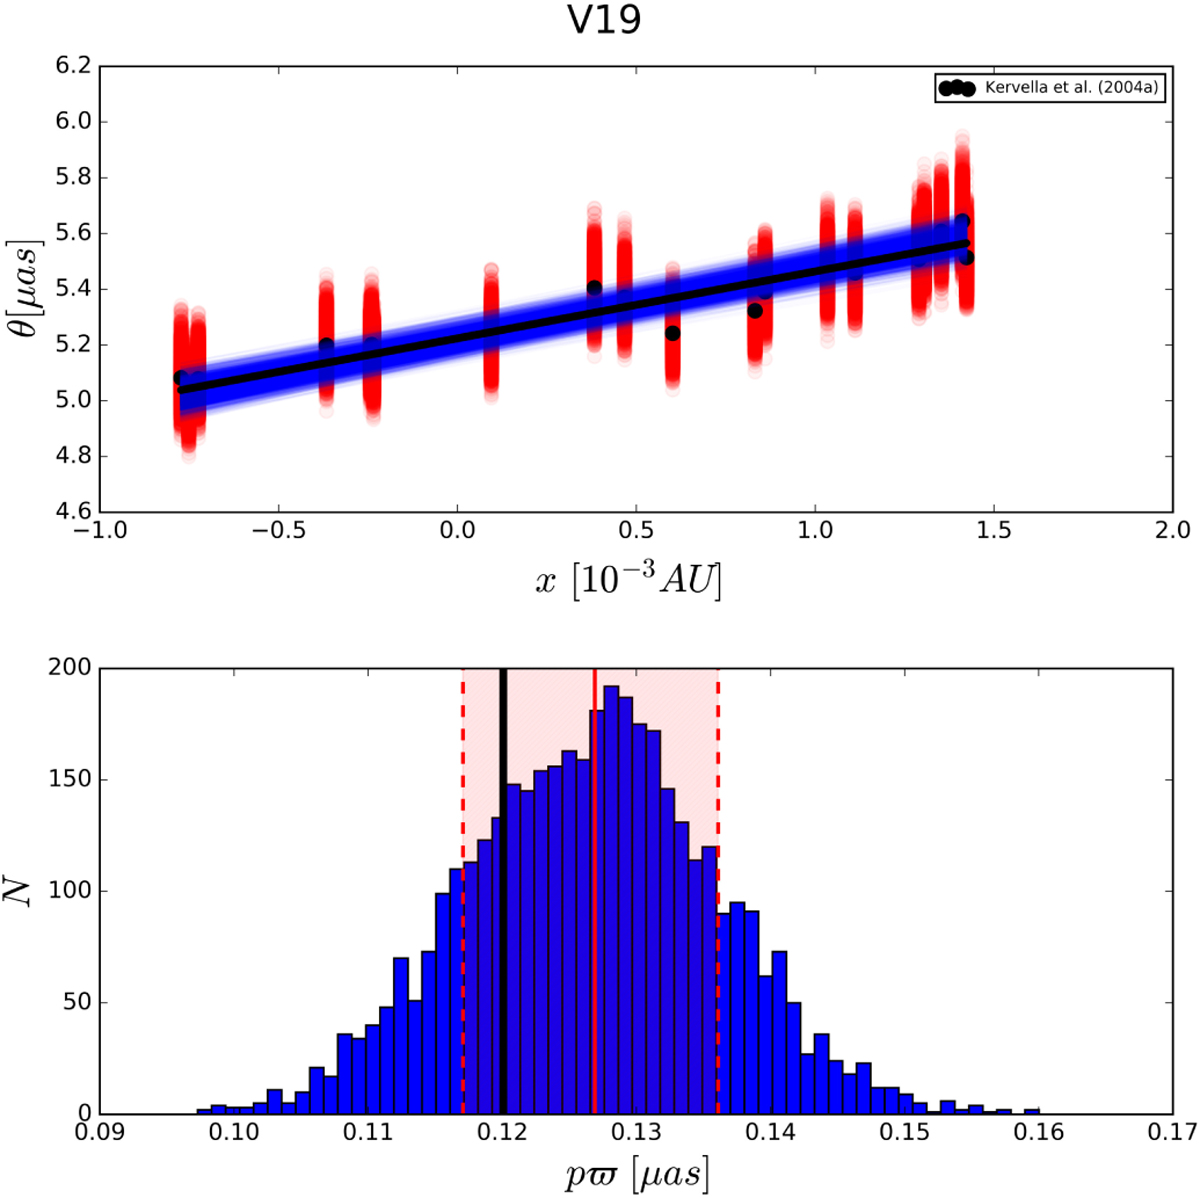
Download original image
Top: bisector fits to MC-simulated data. Bottom: corresponding distribution of fitted slopes, pϖ products, for V 19 together with marked 1σ confidence interval. The distributions corresponding to all stars and all assumed SBCRs are available on Zenodo.
Current usage metrics show cumulative count of Article Views (full-text article views including HTML views, PDF and ePub downloads, according to the available data) and Abstracts Views on Vision4Press platform.
Data correspond to usage on the plateform after 2015. The current usage metrics is available 48-96 hours after online publication and is updated daily on week days.
Initial download of the metrics may take a while.