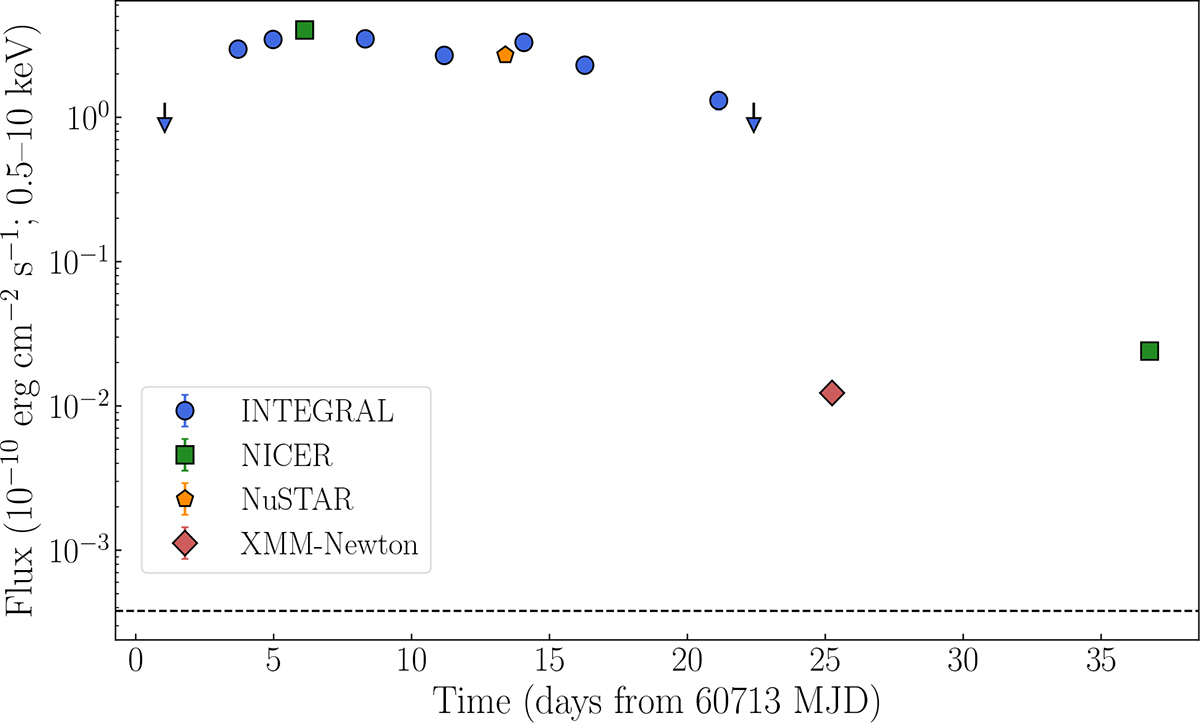
Fig. 1.
Download original image
Light curve in the 0.5–10 keV band of the 2025 outburst of IGR J17511−3057 observed by INTEGRAL (blue points for detections, blue downward arrows for 3σ upper limits; Sguera 2025a), NICER (green squares; the first point is from Sanna et al. 2025, while the last point is discussed in Sect. 3.1.2), NuSTAR (orange pentagon; Sanna et al. 2025), and XMM-Newton (red diamond). The times on the x-axis are given in days since 60713 MJD, corresponding to the first INTEGRAL observation reported for this outburst (Sguera 2025a). The associated error bars are not visible, as they are smaller than the size of the data points. The dashed black line indicates the unabsorbed 0.5–10 keV flux of 3.8 × 10⁻¹⁴ erg cm−2 s−1 estimated during quiescence from the 2019 Chandra observation (Sect. 3.1.3). The INTEGRAL 28–60 keV fluxes, initially expressed in mCrab, were converted to the 0.5–10 keV band and reported in CGS units. We assumed the Crab pulsar’s spectral model from Kirsch et al. (2005) (a power law with a photon index Γ = 2.252 and a normalization N = 15.47 absorbed by an equivalent hydrogen column of NH = 0.4 × 1022 cm−2, adopting the interstellar medium abundance and the cross-section tables from Wilms et al. (2000) and Verner et al. (1996), respectively). The spectrum of IGR J17511−3057 was described with an absorbed semiphenomenological Comptonization model with a seed blackbody component as reported in Sanna et al. (2025) (see Model-I for NuSTAR, Table 2).
Current usage metrics show cumulative count of Article Views (full-text article views including HTML views, PDF and ePub downloads, according to the available data) and Abstracts Views on Vision4Press platform.
Data correspond to usage on the plateform after 2015. The current usage metrics is available 48-96 hours after online publication and is updated daily on week days.
Initial download of the metrics may take a while.