| Issue |
A&A
Volume 706, February 2026
|
|
|---|---|---|
| Article Number | A52 | |
| Number of page(s) | 11 | |
| Section | Astrophysical processes | |
| DOI | https://doi.org/10.1051/0004-6361/202556179 | |
| Published online | 29 January 2026 | |
Detection of low-luminosity X-ray pulsations from the accreting millisecond pulsar IGR J17511−3057: An ever-thinning thread between bright accretion and subluminous states
1
INAF–Osservatorio Astronomico di Brera Via Bianchi 46 I-23807 Merate (LC), Italy
2
INAF-Osservatorio Astronomico di Roma Via Frascati 33 I-00078 Monte Porzio Catone (RM), Italy
3
Institute of Space Sciences (ICE, CSIC), Campus UAB Carrer de Can Magrans s/n E-08193 Barcelona, Spain
4
Institut d’Estudis Espacials de Catalunya (IEEC) E-08860 Castelldefels (Barcelona), Spain
5
INAF, Istituto di Astrofisica Spaziale e Fisica Cosmica Via U. La Malfa 153 I-90146 Palermo, Italy
6
ASI – Agenzia Spaziale Italiana Via del Politecnico snc 00133 Roma, Italy
7
DTU Space, Technical University of Denmark Elektrovej 327-328 DK-2800 Lyngby, Denmark
8
Dipartimento di Fisica, Università degli Studi di Milano Via Celoria 16 I-20133 Milan, Italy
9
Dipartimento di Fisica, Università degli Studi di Cagliari, SP Monserrato-Sestu KM 0.7 Monserrato 09042, Italy
10
Australia Telescope National Facility, CSIRO PO Box 76 Epping New South Wales 1710, Australia
★ Corresponding author: This email address is being protected from spambots. You need JavaScript enabled to view it.
Received:
30
June
2025
Accepted:
8
December
2025
Abstract
After nearly a decade in quiescence, the accreting millisecond pulsar IGR J17511−3057 displayed a new outburst on 2025 February 11, its third since discovery, following previous activity in 2009 and 2015. We report on an XMM-Newton Target of Opportunity observation performed on 2025 March 4, more than twenty days after the outburst onset. From the X-ray spectrum – which is well described by an absorbed Comptonization model – we estimated an unabsorbed 0.5–10 keV luminosity of LX ∼ 7 × 1033 erg s−1 (assuming a source distance equal to the upper limit of 6.9 kpc). To put this into context, we analyzed an archival Chandra observation performed in 2019, which yielded a quiescent luminosity of LX, q ∼ 2 × 1032 erg s−1 in the same energy band. Although this comparison indicates that the source was still well above its quiescent level during the XMM-Newton observation, the estimated low luminosity during the late stage of the 2025 outburst would typically place the source in the propeller regime. Nevertheless, we unexpectedly detected coherent X-ray pulsations with an amplitude peaking at ∼42% in the 0.3–3 keV band. We also observed a spectral softening compared to the early stages of the outburst. Finally, we report a 3σ upper limit of 60 μJy beam−1 on the source flux density at 5.5 GHz from ATCA observations acquired on 2025 April 12, following a decline in the accretion activity, as indicated by our analysis of NICER data from 2025 March 15, which revealed no significant X-ray pulsations at a luminosity level of LX ∼ 1 × 1034 erg s−1. We discuss our findings in the context of other accreting millisecond pulsars and draw comparisons with transitional systems in the subluminous disk state.
Key words: accretion / accretion disks / stars: low-mass / stars: neutron / pulsars: individual: IGR J17511-3057 / X-rays: binaries
© The Authors 2026
 Open Access article, published by EDP Sciences, under the terms of the Creative Commons Attribution License (https://creativecommons.org/licenses/by/4.0), which permits unrestricted use, distribution, and reproduction in any medium, provided the original work is properly cited.
This article is published in open access under the Subscribe to Open model. This email address is being protected from spambots. You need JavaScript enabled to view it. to support open access publication.
1. Introduction
Accreting millisecond pulsars (AMSPs; see Di Salvo & Sanna 2022; Patruno & Watts 2021; Campana & Di Salvo 2018 for reviews) are relatively low-magnetized (B ∼ 108 − 109 G), rapidly rotating (Pspin ≲ 10 ms) neutron stars (NSs), typically found in tight binary systems with low-mass (≲1 M⊙) companions. They attain their rapid spin rates through a gigayear-long phase in which they shine as bright low-mass X-ray binaries (LMXBs), fueled by accreting matter and angular momentum transfer from the subsolar donor star. When accretion stops, the NSs turn on as rotation-powered millisecond pulsars, making AMSPs their likely progenitors (Alpar et al. 1982; Radhakrishnan & Srinivasan 1982).
AMSPs predominantly persist in quiescence, where little or no mass accretion takes place (X-ray luminosity of LX ≲ 1031 − 1033 erg s−1; see, e.g., Campana & Di Salvo 2018), but they can suddenly exhibit mass accretion outbursts lasting from weeks to months, which are marked by a considerable increase in the X-ray luminosity (LX ∼ 1036 − 1037 erg s−1). During outbursts, the in-flowing matter from the companion star is funneled along the NS magnetic field lines and is accreted onto its magnetic poles, giving rise to coherent X-ray pulsations at the millisecond spin period that provide direct probes of the NS properties and emission physics.
The connection between accretion-powered and rotation-powered pulsars has been further strengthened by the discovery of transitional millisecond pulsars (tMSPs; see Papitto & de Martino 2022 and references therein), which can swing between these two states on timescales of days, likely driven by changes in the mass transfer rate from the companion. In addition to these two main states, tMSPs exhibit an intermediate condition, dubbed the subluminous disk state, which is characterized by the presence of an accretion disk, an X-ray luminosity of LX ≃ 1033 − 1034 erg s−1, and a γ-ray luminosity up to ten times higher than that of typical rotation-powered millisecond pulsars (see, e.g., Stappers et al. 2014; Takata et al. 2014; see also Torres et al. 2022 for a review). This intermediate configuration is particularly relevant to this work, as it provides a framework to investigate whether AMSPs, during the late phases of their outbursts, show similarities with tMSPs in the subluminous disk state. A hallmark of this state is erratic X-ray emission, with rapid and unpredictable switches between two distinct intensity levels, named high and low modes (Linares 2014), alongside occasional flaring episodes (see, e.g., Tendulkar et al. 2014; Bogdanov et al. 2015). In the prototype PSR J1023+0038 (Archibald et al. 2009), coherent pulsations have been detected simultaneously in X-ray, UV, and optical bands during X-ray high modes only, vanishing in low modes (Archibald et al. 2015; Ambrosino et al. 2017; Papitto et al. 2019; Jaodand et al. 2021b; Miraval Zanon et al. 2022). This finding, along with the similar pulse profiles and the pulsed spectral energy distribution compatible with a single power law (Papitto et al. 2019; Miraval Zanon et al. 2022), suggests a common emission mechanism. Standard rotation- or accretion-powered mechanisms cannot individually explain all properties (Ambrosino et al. 2017; Papitto et al. 2019). Of particular relevance to this work is the fact that although X-ray pulsations were initially linked to magnetically channeled accretion onto the NS poles (Archibald et al. 2015), this process hardly explains the much higher-than-expected optical pulsed luminosity (Ambrosino et al. 2017; Papitto et al. 2019). This led to a scenario in which X-ray, UV, and optical pulsations during high modes are due to synchrotron radiation from a boundary region ∼100 km from the NS, where the relativistic wind from a rotation-powered pulsar interacts with inflowing matter from the inner accretion disk (Papitto et al. 2019; Veledina et al. 2019; see also Illiano et al. 2023a; Baglio et al. 2023; Coti Zelati et al. 2024; Baglio et al. 2025; Illiano et al. 2025 for recent observations supporting this scenario).
To date, IGR J18245−2452 has been the only tMSP observed to undergo a full accretion outburst in 2013, reaching luminosities and durations typical of classical AMSPs (Papitto et al. 2013). Earlier episodes, more consistent with a subluminous disk state, were identified in 2008 and 2009 archival data (Linares et al. 2013; Pallanca et al. 2013). While the 2008 Chandra light curve showed clear mode-switching, no such behavior was detected in 2013 despite a similar luminosity. However, due to the shorter exposure and lower count rate, the authors could not rule out the presence of comparable variability. Spectral softening was also observed toward the end of the 2013 outburst, with the photon index increasing from Γ ∼ 1.3 to Γ ∼ 2.5 as the X-ray luminosity dropped by about two orders of magnitude (Linares et al. 2013).
The X-ray transient IGR J17511−3057 was discovered during an ∼1-month-long outburst in September 2009 (Baldovin et al. 2009; Bozzo et al. 2010; Markwardt et al. 2009a). Soon after its discovery, the detection of 245 Hz X-ray pulsations confirmed its classification as an AMSP (Markwardt et al. 2009b). The NS is in a 3.47-hour orbit (e.g., Riggio et al. 2011) with a main-sequence companion star that has a mass between 0.15 and 0.44 M⊙ (Papitto et al. 2010). Following an ∼5.5-year-long quiescent period, a second outburst was detected in March 2015 (Bozzo et al. 2015; Papitto et al. 2016). Multiple type-I X-ray bursts were observed during both the 2009 and 2015 outbursts (e.g., Altamirano et al. 2010; Bozzo et al. 2010; Papitto et al. 2010; Falanga et al. 2011; Papitto et al. 2016), with many showing burst oscillations close to the NS spin frequency (Altamirano et al. 2010; Papitto et al. 2016). None of the bursts exhibited signs of photospheric radius expansion, allowing only for an upper limit on the source distance of 6.9 kpc (Altamirano et al. 2010).
After nearly a decade in quiescence, IGR J17511−3057 showed a third outburst detected by INTEGRAL on 2025 February 11 (Sguera 2025a,b), and was confirmed by NICER through the detection of coherent X-ray pulsations at the known spin frequency (Ng et al. 2025). In this paper, we report on a XMM-Newton Target of Opportunity (ToO) observation performed on 2025 March 4, when the source had already faded to a relatively low luminosity level. We also report on a NICER observation performed on 2025 March 15 and a radio observation with the Australia Telescope Compact Array (ATCA) on 2025 April 12. To put the low luminosity observed with XMM-Newton into context, we analyzed an archival Chandra observation from 2019, when the source was in quiescence. In Sect. 2, we describe XMM-Newton, NICER, Chandra, and ATCA observations and data reduction. The X-ray spectral analysis of XMM-Newton, NICER, and Chandra is presented in Sect. 3.1, while the timing analysis of XMM-Newton and NICER data is detailed in Sect. 3.2. Finally, in Sect. 4, we provide an interpretation of our findings and discuss their implications, while Sect. 5 summarizes our main conclusions.
2. Observations
2.1. XMM-Newton
XMM-Newton (Jansen et al. 2001; Schartel et al. 2022) observed IGR J17511−3057 on 2025 March 4 (Obs. ID: 0954191401; PI: Illiano), ∼21 days after the onset of the outburst (see Fig. 1 and Sect. 3.1.1 for details), once the source became visible to the satellite following an initial period of visibility constraints. The EPIC-pn (Strüder et al. 2001) operated in fast timing mode, offering a time resolution of 29.5 μs, while the two EPIC-MOS cameras (Turner et al. 2001) were set to small window mode, providing a time resolution of 0.3 s. We processed and analyzed the Observation Data Files (ODF) using the Science Analysis Software (SAS; v.21.0.0). We corrected the photon arrival times to the Solar System Barycenter using the JPL ephemerides DE405 (Standish 1998) and the barycen task. We adopted the source coordinates RA (J2000) = 17h51m08.66s and Dec. (J2000) = − 30° 57′41.0″ (Paizis et al. 2012). We excluded the final ∼13.5, ∼15.7, and ∼15.6 ks of data from the EPIC-pn, MOS1, and MOS2, respectively, due to elevated background flaring activity in the 10–12 keV light curves. The resulting net exposures were ∼20 ks for each of the EPIC instruments. For the EPIC-pn, source photons were extracted from a 11-pixel-wide strip centered on the brightest pixel column (RAWX = 32–42), while background photons were taken from a strip with the same width far from the source position (RAWX = 3–13). For each MOS, source photons were extracted from a circular region with a 40″ radius centered on the source position, and background photons from a 80″ wide, source-free circular region on one of the outer CCDs. No type-I X-ray bursts were detected during the XMM-Newton observation.
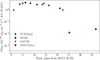 |
Fig. 1. Light curve in the 0.5–10 keV band of the 2025 outburst of IGR J17511−3057 observed by INTEGRAL (blue points for detections, blue downward arrows for 3σ upper limits; Sguera 2025a), NICER (green squares; the first point is from Sanna et al. 2025, while the last point is discussed in Sect. 3.1.2), NuSTAR (orange pentagon; Sanna et al. 2025), and XMM-Newton (red diamond). The times on the x-axis are given in days since 60713 MJD, corresponding to the first INTEGRAL observation reported for this outburst (Sguera 2025a). The associated error bars are not visible, as they are smaller than the size of the data points. The dashed black line indicates the unabsorbed 0.5–10 keV flux of 3.8 × 10⁻¹⁴ erg cm−2 s−1 estimated during quiescence from the 2019 Chandra observation (Sect. 3.1.3). The INTEGRAL 28–60 keV fluxes, initially expressed in mCrab, were converted to the 0.5–10 keV band and reported in CGS units. We assumed the Crab pulsar’s spectral model from Kirsch et al. (2005) (a power law with a photon index Γ = 2.252 and a normalization N = 15.47 absorbed by an equivalent hydrogen column of NH = 0.4 × 1022 cm−2, adopting the interstellar medium abundance and the cross-section tables from Wilms et al. (2000) and Verner et al. (1996), respectively). The spectrum of IGR J17511−3057 was described with an absorbed semiphenomenological Comptonization model with a seed blackbody component as reported in Sanna et al. (2025) (see Model-I for NuSTAR, Table 2). |
2.2. NICER
The Neutron star Interior Composition Explorer (NICER; Gendreau et al. 2012) observed IGR J17511−3057 during two separate intervals. The first set of observations, conducted between 2025 February 11 and 14, captured the onset of the X-ray outburst and are discussed in detail by Sanna et al. (2025). In this work, we focus on the observations performed on March 15, 2025 (Obs. ID: 7512010105), following a period during which the source was not visible. We analyzed the NICER data using HEASoft version 6.34 and NICERDAS version 12, with calibration files from CALDB version 20240206. Data processing was carried out using the nicerl2 task. The obtained cleaned event files were used to generate spectral products via the nicerl3-spect task, with SCORPEON background model (version 23) with the setting bkgformat=file. Spectra were grouped using the ftgrouppha tool, automatically invoked by the nicerl3-spect task, applying the “optimal binning” scheme (Kaastra & Bleeker 2016), with a minimum of 25 counts per energy bin (using the options GROUPTYPE=OPTMIN and GROUPSCALE = 25). Using the nicerl3-lc pipeline, we extracted the 0.3–10 keV light curve, which showed an average count rate of ∼1 cts s−1, significantly lower than the rate of 52 cts s−1 observed at the beginning of the outburst (Sanna et al. 2025). No type-I X-ray bursts were detected during this NICER observation. We corrected the photon arrival times to the Solar System Barycenter using the same ephemerides and source coordinates adopted for the XMM-Newton data (see Sect. 2.1).
2.3. Chandra
IGR J17511−3057 was observed in quiescence by the Chandra X-ray observatory (e.g., Weisskopf et al. 2000) on 2019 July 27 (Obs. ID: 21228). The observation was performed using the Advanced CCD Imaging Spectrometer (ACIS; Garmire et al. 2003), with the source placed on the back-illuminated S3 chip (CCD ID: 7) of the spectroscopic array (ACIS-S). The total exposure time was ∼29.6 ks, and data were acquired in faint mode. We processed and analyzed the data using the Chandra Interactive Analysis of Observations (CIAO, v.4.17; Fruscione et al. 2006) software package, along with the calibration files from CALDB version 4.12.0. The dataset was first reprocessed with the chandra_repro tool using default parameters. The source was detected using wavdetect with default parameters, yielding a net count rate of ∼1.2 × 10⁻³ counts s−1. Source and background spectra were extracted using the specextract tool. We grouped the spectra using the GRPPHA tool from the FTOOLS software package, ensuring at least one count per bin.
2.4. ATCA
We conducted radio observations of IGR J17511−3057 on 2025 April 12 using the Australia Telescope Compact Array (ATCA) as part of program CX598 (PIs: Carotenuto & Russell). To maximize uv-coverage1, the observations were split into two segments: the first was performed from 17:19 UT to 18:25 UT, and the second from 22:53 UT to 23:59 UT. ATCA was undergoing a correlator upgrade, limiting data acquisition to a single band with a central frequency of 5.5 GHz and a 2-GHz bandwidth. For calibration, we used B1934−638 as the primary calibrator for both bandpass and flux density, while PKS 1741-312 served as the complex gain calibrator. The data were processed using standard flagging, calibration, and imaging techniques within the Common Astronomy Software Applications (CASA) package (CASA Team 2022). Imaging was performed with the tclean task, adopting a Briggs weighting scheme with a robust parameter of 0.5. After combining the two intervals, no radio counterpart was detected at the location of IGR J17511−3057. Furthermore, due to the 10-second time resolution, these interferometric observations are not sensitive to the narrow, individual pulses typical of most radio MSPs, which exhibit low duty cycles and short pulse widths (e.g., Manchester et al. 2005). We derived a 3σ upper limit on the total flux density of IGR J17511−3057 of 60 μJy beam−1 at 5.5 GHz. This result is discussed in Sect. 4.3.
3. Analysis and results
3.1. Spectral analysis
We performed the X-ray spectral analysis on Chandra archival data acquired during quiescence in 2019 (Sect. 3.1.3), as well as on XMM-Newton (Sect. 3.1.1) and NICER data (Sect. 3.1.2) obtained during the late stage of the 2025 outburst. All spectra were fit using the X-ray spectral fitting package XSPEC (Arnaud 1996) version 12.14.1. We adopted the interstellar medium abundance and the cross-section tables from Wilms et al. (2000) and Verner et al. (1996), respectively. All uncertainties on spectral parameters are given at the 1σ confidence level.
3.1.1. XMM-Newton
The average EPIC-pn spectrum was extracted with a minimum of 50 counts in each channel. Data below 0.7 keV were excluded due to calibration issues in the EPIC-pn data acquired in timing mode2. The final analysis was restricted to the 1–7 keV band, as the background dominates outside this range. The average EPIC-MOS1 and EPIC-MOS2 spectra were extracted in the 0.3–10 keV band, with a minimum of 25 counts in each channel. We included a renormalization factor in our spectral modeling to address cross-calibration uncertainties between the different instruments and always verified that these factors were consistent within 10%.
To better constrain other parameters, we fixed the absorption column density to NH = 1.06 × 1022 cm−2, as obtained by Sanna et al. (2025). We use this value consistently throughout the rest of the paper. We first fit the spectrum with an absorbed power-law model (constant * TBabs * powerlaw), yielding a χ2 = 169.88 for 149 degrees of freedom (d.o.f. in the following). Since the X-ray spectra of AMSPs in outbursts are typically described by thermally Comptonized emission (e.g., Di Salvo et al. 2023), we replaced the power-law component with the convolution model thcomp (Zdziarski et al. 2020) applied to the bbodyrad component (constant * TBabs * (thcomp * bbodyrad); see Fig. 2). When left as a free parameter, the covering fraction, representing the fraction of Comptonized photons, always reached its hard limit set at 1, and was therefore fixed at this value. Due to the lack of spectral coverage above 10 keV, we fixed the electron temperature, kTe, to 20 keV based on the results of Sanna et al. (2025). This revised model provided a significantly improved fit, with a decrease in χ2 of about 35 for one fewer degree of freedom compared to the power-law model. The best-fit parameters are listed in Table 1. The unabsorbed 0.5–10 keV flux, F0.5 − 10, was estimated by including the cflux component.
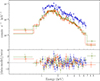 |
Fig. 2. X-ray spectrum of IGR J17511-3057 as observed by XMM-Newton on 2025 March 4 with EPIC-pn (blue), EPIC-MOS1 (orange), and EPIC-MOS2 (green), along with the best-fitting model constant * TBabs * (thComp*bbodyrad) (see Table 1). The bottom panel displays the residuals from the fit. |
Best-fit spectral parameters from the XMM-Newton observation for the model constant * TBabs * (thComp*bbodyrad).
Figure 1 compares the estimated unabsorbed 0.5–10 keV flux from Table 1 with values obtained by INTEGRAL (Sguera 2025a), NICER, and NuSTAR (Sanna et al. 2025) during the 2025 outburst of IGR J17511−3057. Our flux estimate is about two orders of magnitude lower than those reported earlier in the outburst. Using the upper limit on the source distance of 6.9 kpc – estimated by Altamirano et al. (2010) from the absence of photospheric radius expansion in any of the detected type-I X-ray bursts – we derived an X-ray luminosity in the 0.5–10 keV band of LX ∼ 7 × 1033 erg s−1. This is more than one order of magnitude higher than the quiescent luminosity derived from the 2019 Chandra observation, LX, q ∼ 2 × 1032 erg s−1 (see Sect. 3.1.3).
3.1.2. NICER
We analyzed the NICER spectrum in the 1–5 keV band, as the background dominates outside this range. The absorption column density was fixed to the same value used in the modeling of the EPIC-pn spectrum (Table 1). We first described the continuum with an absorbed power-law emission (TBabs * pegpwrlw), resulting in a fit statistic of χ2 = 34.91 for 45 d.o.f. The best-fit photon index was Γ = 1.9 ± 0.2, and the unabsorbed flux in the 0.5–10 keV band was F0.5 − 10 = (2.4 ± 0.2)×10−12 erg cm−2 s−1 (corresponding to LX ∼ 1 × 1034 erg s−1 for d = 6.9 kpc). Following the approach used for the XMM-Newton spectrum (see Sect. 3.1.1), we tested an alternative model replacing the power-law with a Comptonization component (TBabs * nthComp), and fixing the electron temperature at 20 keV (see Sect. 3.1.1). The resulting fit yielded a χ2 = 34.90 for 44 d.o.f., indicating no significant improvement over the power-law model. We also tried the convolution model TBabs * (thcomp*bbodyrad), but the parameters of the blackbody component were not constrained by the data, likely due to the limited photon statistics. The unabsorbed 0.5–10 keV flux derived from the power-law model is roughly twice that estimated in the XMM-Newton observation performed ∼11 days earlier (see Fig. 1). This increase may indicate reflare activity, namely luminosity variations commonly observed toward the end of outbursts in several AMSPs (see, e.g., Patruno & Watts 2021, and references therein).
3.1.3. Chandra (2019)
We fit the Chandra spectrum in the 0.3–10 keV energy range. Given the low number of counts (see Sect. 2.3), we adopted the Cash statistic (C-statistic; Cash 1979) for spectral fitting. We modeled the spectrum using either an absorbed power law or a blackbody model. All fits included interstellar absorption, with the hydrogen column density fixed to the value reported for the EPIC-pn spectrum (Table 1). Using the TBabs*pegpwrlw model, the best-fit photon index was Γ = 1.3 ± 0.4 – consistent with the other values reported in both this work, given the large associated uncertainty –, and the unabsorbed 0.5–10 keV flux was  . We also fit the spectrum with a blackbody model (TBabs*bbodyrad), including the cflux component to estimate the unabsorbed flux. The best-fit parameters were a blackbody temperature of
  , a normalization of
  , and an unabsorbed 0.5–10 keV flux of F0.5 − 10, q = (2.5 ± 0.5)×10−14 erg cm−2 s−1. Simultaneous fits using both a power-law and a thermal component yielded unconstrained parameters due to low photon statistics. However, the small normalization of the blackbody model suggests that the power-law component may be physically preferable. This interpretation is consistent with past works, where the quiescent X-ray spectra of most AMSPs are dominated by a power-law–like component, likely arising from residual accretion or magnetospheric processes related to the NS magnetic field (see, e.g., Marino et al. 2022, and references therein). In any case, the two flux estimates reported above are consistent with each other within less than 2σ. Therefore, to conservatively estimate the quiescent luminosity, we adopted the higher flux value obtained from the power-law model. Assuming an upper limit on the source distance of d ∼ 6.9 kpc (Altamirano et al. 2010), we derived a quiescent X-ray luminosity of IGR J17511−3057 of LX, q ∼ 2 × 1032 erg s−1 in the 0.5–10 keV band.
3.2. Timing analysis
3.2.1. XMM-Newton
To correct the photon arrival times for the pulsar’s orbital motion in the binary system in the 0.3–10 keV XMM-Newton/EPIC-pn time series, we adopted the timing solution obtained with NICER and NuSTAR during this outburst by Sanna et al. (2025), namely a spin frequency of ν = 244.83395034(3) Hz (corresponding to a spin period of Ps = 0.0040844008709(5) s), an orbital period of Porb = 12487.505(2) s, a projected semi-major axis of a1 sin i = 0.275197(8) lt − s, and an epoch of passage at the ascending node of Tasc = 60717.674090(3) MJD(TDB) (with respect to the reference epoch Tref = 60717.7 MJD(TDB)). The sensitivity to Tasc that can be obtained by analyzing the XMM-Newton observation is ∼7 s (e.g., Caliandro et al. 2012), much lower than the above-reported estimate previously obtained from phase-connected pulsar timing.
After correcting the photon arrival times using the values mentioned above, we performed an epoch-folding search (EFS; Leahy et al. 1983; Leahy 1987) to investigate the presence of periodic signals. We folded the data around the previously mentioned spin frequency. We used m = 10 phase bins, a period step of ΔP = Ps2/(2mT)≃4.2 × 10−11 s (where T is the observation exposure), and 128 trial periods. The resulting EFS, shown in the top panel of Fig. 3, reveals a clear peak, from which the best-fit value for the spin period was determined by modeling the χ2 distribution with a Gaussian function. We estimated the associated uncertainty in the spin period using the method described by Leahy (1987). The best-fit spin period was 0.0040844009(1) s (corresponding to a frequency of 244.833950(6) Hz), which is consistent within 1σ with the earlier estimate. Since we were unable to further improve the precision of this measurement with XMM-Newton data, we fixed the spin frequency at ν = 244.83395034(3) Hz for the remaining analysis. Using the maximum χ2 value of the EFS and the cumulative distribution function of the χ2 with m − 1 degrees of freedom, we derived a false alarm probability of ∼4.2 × 10⁻¹⁰, corresponding to a single-trial statistical significance exceeding 6σ. This clearly indicates the presence of X-ray pulsations, even though the source luminosity had already decreased by more than two orders of magnitude compared to previous INTEGRAL, NICER, and NuSTAR observations (see Fig. 1).
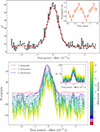 |
Fig. 3. Top panel: Epoch-folding search obtained with 128 trial periods by sampling each period with ten phase bins. The black points represent the resulting χ2 values, while the red line shows the best-fit Gaussian model used to determine the spin period. The indicated x-axis offset corresponds to Ps = 0.0040844008709 s. The inset in the top-right corner shows the corresponding pulse profile using ten phase bins around Ps, with Tref = 60717.7 MJD(TDB) as reference epoch. Bottom panel: H-statistic values as a function of the trial periods, computed using the same grid as in the epoch-folding search. For each trial period, we selected the harmonic number that maximized the H-statistic. The red, pink, and dark blue lines represent the values computed for 1, 2, and 3 harmonic terms, respectively. The remaining harmonics, up to 20 following the recommendation of de Jager & Büsching (2010), are color-coded according to the viridis colormap shown on the right. The inset in the top-right corner shows the corresponding Rayleigh statistics (Zn2; Buccheri et al. 1983) as a function of the trial periods, using the same color scheme. See Sect. 3.2.1 for details. |
Up to five harmonic components have been reported to significantly contribute to the pulse profiles of IGR J17511−3057 (Papitto et al. 2010; see also Riggio et al. 2011; Papitto et al. 2016; Sanna et al. 2025). To determine the optimal number of harmonic terms needed to describe the X-ray pulsations detected during the XMM-Newton observation, we computed the H-statistic (e.g., de Jager & Büsching 2010, and references therein) as a function of the trial periods. The results, shown in the bottom panel of Fig. 3, indicate that the signal is best described by a single harmonic component, consistent with previous findings that the first harmonic dominates the pulse profile (Papitto et al. 2010; Riggio et al. 2011; Papitto et al. 2016; Sanna et al. 2025). The harmonic content is likely determined by geometric effects and the observer viewing angle (e.g., Poutanen & Beloborodov 2006; Das et al. 2025).
Due to the low observed X-ray flux, it was not possible to use the XMM-Newton data to derive an independent coherent timing solution. Consequently, we were unable to study the evolution of the X-ray pulsation phase. Instead, we folded the entire observation across different energy ranges using ten phase bins around Ps and using the corresponding reference epoch Tref, as defined above (see the inset in the top panel of Fig. 3). We modeled the folded pulse profiles with one harmonic term, as suggested by the H-test (see bottom panel of Fig. 3). Additionally, we performed an energy-resolved analysis of the 0.3–10 keV pulsations to explore their spectral dependence. The results are summarized in Table 2. We found that X-ray pulsations are significantly stronger at lower energies. In the 0.3–3 keV and 0.3–5 keV bands, pulsations are detected at > 5σ significance. In contrast, the 3–10 keV and 5–10 keV bands show much weaker or absent pulsations, with significances of 2.1σ and 0.3σ, respectively. This may be due either to lower photon statistics at higher energies, as indicated by the source and background counts in Table 2, or to an intrinsically lower pulsed amplitude in these bands. In both cases, the results indicate that the pulsed signal is dominated by soft X-ray photons.
Properties of X-ray pulsations with energy.
3.2.2. NICER
After correcting the photon arrival times for the NS orbital motion using the orbital parameters provided in Sect. 3.2.1, we searched for a coherent signal in the Leahy-normalized Fourier power spectrum (Leahy et al. 1983) of the 0.3–10 keV NICER data. The frequency resolution of the power spectrum computed over the full observation duration (Tobs ∼ 6.5 ks, δν = 1.5 × 10⁻⁴ Hz) is much coarser than the accuracy in the available pulsar ephemeris. Consequently, the search for a coherent signal at the known NS spin period was constrained to a single-trial analysis. For such a search, the power threshold corresponding to a 3σ confidence level (false alarm probability p = 2.7 × 10⁻³)3 is approximately 2ln(1/p) ≃ 11.8. Given a total of Nph = 2172 counts and a Nyquist frequency of 1 kHz, the observed power of ∼6.5 translates into a 3σ upper limit on the pulsed amplitude of ∼18%, following the approach of Vaughan et al. (1994). Accounting for the average background rate (Rbkg ∼ 0.16 cts s−1), this upper limit increases to ∼31% in the 0.3–10 keV band. Although the background-subtracted pulsed amplitude estimated with XMM-Newton in the same energy band slightly exceeds this limit, it remains consistent within the uncertainties (see Table 2). Moreover, Sanna et al. (2025) reported a pulsed amplitude of ∼19% with NICER at the onset of the outburst. Therefore, the non-detection of coherent pulsations in the NICER observation from March 15, 2025 cannot be taken as definitive evidence of a significant decrease in the pulse amplitude. However, this could result from limited sensitivity, since the substantially lower average count rate of ∼1 cts s−1, in contrast to the rate of 52 cts s−1 recorded early in the outburst, suggests a substantial decline in the mass accretion rate onto the NS during the later stages of the outburst.
3.3. Light curve
Figure 4 shows the background-subtracted light curve from the three EPIC instruments over the time interval of simultaneous coverage, binned at a 50-s resolution. The light curves from each detector were extracted using the epiclccorr task and combined with the lcmath task. The distribution of count rates is shown in Fig. 5. Our findings are discussed in Sect. 4.2.
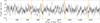 |
Fig. 4. Background-subtracted light curve from the three EPIC instruments over the time interval of simultaneous coverage, binned at a 50-s resolution. The yellow-shaded regions highlight potential low modes (see Sect. 1 for details). Time is expressed in seconds relative to the reference time Tref = 60738.0582657791310339 MJD (TDB). |
4. Discussion
In this paper, we reported on the detection of coherent X-ray pulsations from the AMSP IGR J17511−3057 observed with XMM-Newton during a ToO observation conducted about twenty days after the onset of its 2025 outburst (see Fig. 1). Given that past outbursts from this source typically lasted for ∼25–30 days (e.g., Papitto et al. 2010; Riggio et al. 2011; Papitto et al. 2016), our observation likely captured the system during its final stages of activity. Spectral analysis revealed a 0.5–10 keV unabsorbed X-ray flux of FX = (1.23 ± 0.04)×10−12 erg cm−2 s−1. Assuming the upper limit on the source distance of d ∼ 6.9 kpc (Altamirano et al. 2010), this corresponds to an X-ray luminosity of LX ∼ 7 × 1033 erg s−1. To put this measurement into context, we analyzed an archival Chandra observation performed in 2019 during quiescence, from which we derived a 0.5–10 keV luminosity of LX, q ∼ 2 × 1032 erg s−1 (see Sect. 3.1.3). This indicates that the source was still over an order of magnitude brighter than its quiescent level at the time of the XMM-Newton observation. In the following, we discuss our results within the framework of the standard accretion–propeller boundary and examine the increasingly subtle distinction between AMSPs during the late phases of the X-ray outbursts and tMSPs in their subluminous disk state.
4.1. Pushing beyond the propeller limit
The detection of coherent millisecond pulsations from AMSPs is thought to provide strong evidence for ongoing accretion onto the NS magnetic poles. Specifically, accretion-powered X-ray pulsations imply that the inner disk radius must be truncated not significantly beyond the corotation radius, defined as the distance at which the angular velocity of a disk matter element in a Keplerian orbit matches that of the corotating system formed by the NS and its magnetosphere. The corotation radius is given by
![Mathematical equation: $$ \begin{aligned} {R_{\rm {co}}} = \left[ \frac{G M_{\mathrm{ns} }}{(2 \pi \nu )^2} \right]^{1/3} \simeq 1.68 \times 10^{6} \, {M_{1.4}} \, {P_{\rm {ms}}}^{2/3} \, \mathrm{cm} , \end{aligned} $$](/articles/aa/full_html/2026/02/aa56179-25/aa56179-25-eq6.gif) (1)
(1)
where M1.4 is the NS mass (Mns) in units of 1.4 M⊙ and Pms is the spin period in ms. For a 1.4 M⊙ NS and a spin period of ∼4.1 ms, Rco ≃ 43 km. If the inner disk were truncated beyond this radius, the rapidly rotating magnetosphere would act as a centrifugal barrier, preventing accretion in the so-called propeller regime (Illarionov & Sunyaev 1975). To estimate the mass accretion rate during the XMM-Newton observation, we extrapolated the unabsorbed X-ray flux in the 0.1–100 keV band, FX = (1.44 ± 0.06)×10−12 erg cm−2 s−1. For d = 6.9 kpc and assuming isotropic emission, the accretion rate is Ṁ = 4πd2FXRns/(GMns) ≃ 4 × 10¹³ g s−1 for a 1.4 M⊙ NS with a Rns = 10 km radius. The truncation radius of the disk, Rm, is assumed to be ξ times the Alfvén radius (e.g., Ghosh & Lamb 1979) and is expressed as
![Mathematical equation: $$ \begin{aligned} R_{\mathrm{m} } = \xi \left[ \frac{(B_{\mathrm{s} } R_{\mathrm{ns} }^3)^4}{(2 G M_{\mathrm{ns} } \dot{M}^2)} \right]^{1/7}, \end{aligned} $$](/articles/aa/full_html/2026/02/aa56179-25/aa56179-25-eq7.gif) (2)
(2)
where Bs is the NS magnetic field strength at surface, and G is the gravitational constant. Requiring Rm < Rco for accretion to proceed, we derived an upper limit on the magnetic field:
 (3)
(3)
where we adopted ξ = 0.5 (see, e.g., Campana et al. 2018). However, Sanna et al. (2025) reported constraints on the magnetic field strength of 7.6 × 10⁸ G < Bs < 1.1 × 10⁹ G based on the secular spin-down of the pulsar during quiescence, interpreted as due to magnetic dipole radiation. This field strength exceeds the value required to maintain Rm < Rco during the XMM-Newton observation. We note that both field strength estimates rely on simplifying assumptions. Our limit depends on the adopted conversion from the X-ray luminosity to Ṁ, on the assumed NS parameters, and on the value of ξ relating the magnetospheric and Alfvén radii, while the secular spin-down estimate assumes a specific torque mechanism in quiescence, a canonical moment of inertia, and does not account for possible spin-up episodes during outbursts. Although it is difficult to quantitatively assess the uncertainties associated with these assumptions, the two estimates for the magnetic field intensity still differ by about one to two orders of magnitude. If accretion is still ongoing – as supported by the detection of coherent X-ray pulsations – and the average long-term spin down is a good tracer of the NS magnetic field, then our findings would suggest that the truncation radius of the disk can remain within the corotation radius even at very low X-ray luminosities, comparable to those seen in tMSPs during their subluminous disk state (see Sections 1 and 4.2). This result is consistent with what was found by Patruno et al. (2016), whose multiwavelength analysis of the reflaring phases of the prototype of AMSP SAX J1808.4−3658 showed that the persistence of pulsations and a stable hard X-ray spectrum imply a disk truncated near the corotation radius during the late stages of the outburst.
Different mechanisms have been proposed to explain how accretion can persist in such a low-luminosity regime (e.g., Archibald et al. 2015; Papitto et al. 2015; Bult et al. 2019a). One possibility is that, at low accretion rates, the inner accretion flow becomes radiatively inefficient, so only a fraction of the accretion power is emitted in X-rays while most of it is instead lost through outflows (e.g., Zuo et al. 2025). As a result, the actual mass accretion rate – and thus the ram pressure acting on the NS magnetosphere – may be greater than inferred from the observed X-ray luminosity, allowing the disk to remain close to the corotation radius. Another possibility is the “trapped disk” configurations (Spruit & Taam 1993; D’Angelo & Spruit 2010; D’Angelo & Spruit 2012), in which the magnetosphere rotates only slightly faster than the inner disk. In this case, the centrifugal barrier is not sufficient to expel the inflowing matter, allowing material to accumulate near the magnetospheric radius and accrete episodically. On the other hand, three-dimensional magnetohydrodynamic simulations have revealed that accretion and ejection can coexist in the propeller regime, even when the inner disk lies beyond the corotation radius (see Romanova et al. 2018, and references therein).
During the 2025 outburst, Sanna et al. (2025) reported average background-subtracted amplitude of ∼19% for the first harmonic with NICER (0.3–10 keV) and NuSTAR (3–40 keV). Specifically, the NICER data showed a rise from ∼16% at the low energies up to ∼21%, while the NuSTAR pulse profiles revealed a peak amplitude of ∼22% in the 3–6 keV range, decreasing at the higher energies. The results are broadly consistent with previous outbursts (Papitto et al. 2010; Riggio et al. 2011; Papitto et al. 2016). In terms of energy dependence, XMM-Newton and RXTE observations during the 2009 outburst showed that the amplitude of the first harmonic increased with energy up to ∼20–25% in the 3–6 keV range, and then gradually decreased at higher energies (Papitto et al. 2010). The 2025 XMM-Newton observation presented in this work revealed a background-subtracted amplitude of ∼33% in the 0.3–10 keV band, peaking at ∼42% in the softer 0.3–3 keV band. Pulsations were not significantly detected above this energy (see Table 2). Such high pulse amplitudes are rare among AMSPs, although similar values have been observed in a few systems – such as XTE J1807−294 (up to 27% in the 2.5–30 keV band; Patruno et al. 2010), Swift J1749.4−2807 (up to 23% in the 2–10 keV band; see, e.g., Altamirano et al. 2011; Sanna et al. 2022), and IGR J17379−3747 (up to 70% in the 0.4–6 keV band; Sanna et al. 2018; Bult et al. 2019a). Interestingly, the latter also displayed pulsations down to luminosities as low as ∼5 × 1033 erg s−1 (Bult et al. 2019a), similar to the results presented in this paper for IGR J17511−3057. According to Poutanen & Beloborodov (2006), such large pulse amplitudes can be explained by a favorable viewing geometry, in which the sum of the inclination angle and spot colatitude is close to 90°. This geometric configuration may explain the unusually high pulse amplitude observed in these two AMSPs, which likely enables the detection of X-ray pulsations even at low accretion rates, as further discussed in the following paragraph.
The low-luminosity X-ray pulsations observed from IGR J17511−3057 in this work and IGR J17379−3747 by Bult et al. (2019a) are rare among AMSPs. This rarity could be partly attributed to the sensitivities of the X-ray telescopes, as well as the relatively low pulse amplitudes of most systems. A useful comparison can be made with the extensively studied AMSP SAX J1808.4−3658 (Wijnands & van der Klis 1998), which has exhibited ten ∼1-month-long outbursts every ∼3 years since its discovery as the first system of this kind (see Illiano et al. 2023b, and references therein). The amplitude of X-ray pulsations observed from SAX J1808.4−3658 typically ranges between ∼3–7% (e.g., Hartman et al. 2008, 2009; Patruno et al. 2012; Sanna et al. 2017; Bult et al. 2020; Illiano et al. 2023b), although larger values have been observed in the late stages of the outburst (e.g., Hartman et al. 2008; Patruno et al. 2009; Bult et al. 2020; Illiano et al. 2023b; Ballocco et al. 2026). Although X-ray pulsations from SAX J1808.4−3658 have been consistently detected across its outbursts, including during the late accretion phases known as reflares, they have only been observed down to luminosities of ∼(2 − 6)×1034 erg s−1 in the 0.5–10 keV band (e.g., Hartman et al. 2008; Patruno et al. 2009; Bult et al. 2019b; Ballocco et al. 2026), and never at luminosities as low as those seen in IGR J17511−3057 and IGR J17379−3747. Considering the single-trial sensitivity required for a 3σ confidence level detection (see van der Klis 1988; Vaughan et al. 1994), a typical pulse amplitude of 5% in SAX J1808.4−3658 would, in principle, be detectable down to a minimum 0.5–10 keV luminosity of ∼3 × 1033 erg s−1 in a 50 ks XMM-Newton observation (adopting the commonly used distance of 3.5 kpc from Galloway & Cumming (2006), although Galloway et al. (2024) recently suggested a revised distance of 2.7 kpc). However, in practice, capturing SAX J1808.4−3658 at such low luminosity before it fades into quiescence remains observationally challenging, especially due to the presence of the typical reflaring phase. This underscores how AMSPs with intrinsically higher pulse amplitudes, such as IGR J17511−3057 and IGR J17379−3747, represent a unique opportunity for studying X-ray pulsations at the lowest accretion luminosities during the late stages of their outbursts.
Similar to IGR J17379−3747 (Bult et al. 2019a), the X-ray spectrum of IGR J17511−3057 becomes significantly softer in the late stages of the 2025 outburst. During the XMM-Newton observation, we found a photon index of Γ ≃ 2.2 (Table 1), in contrast to the harder spectra reported earlier in the outburst with NICER and NuSTAR (Γ ≃ 1.7 − 1.8; Sanna et al. 2025). This spectral softening toward the end of the outburst mirrors trends seen in both black hole (e.g., Wu & Gu 2008; Plotkin et al. 2013) and NS binaries (see Wijnands et al. 2015, and references therein). For NS binaries, possible explanations for this behavior involve residual accretion onto the NS surface (e.g., Campana et al. 1998) or the gradual cooling of the stellar crust, previously heated during the outburst (e.g., Brown et al. 1998). However, Allen et al. (2015) found that the spectral softening in the NS LMXB SAX J1750.8−2900 is best explained by ongoing low-level accretion, based on the presence of rapid variability and correlated spectral changes, which are inconsistent with the timescales expected from crustal cooling alone. The detection of coherent X-ray pulsations in both IGR J17511−3057 (this work) and IGR J17379−3747 (Bult et al. 2019a) at low-luminosity levels supports the presence of a residual accretion. The findings discussed in this section support the idea that at least some AMSPs can sustain accretion-powered X-ray pulsations down to remarkably low luminosities, challenging the traditional boundary between the accretion and propeller regimes.
4.2. Comparison with transitional millisecond pulsars
Despite a two-order-of-magnitude decline compared to earlier outburst levels (Fig. 1), the 2025 XMM-Newton luminosity remained significantly above the quiescent level and falls within the typical range observed in the intermediate subluminous disk state of tMSPs. Motivated by this, we searched for potential bimodality between high and low intensity levels in the X-ray light curve. Figure 4 shows the background-subtracted light curve from the three EPIC instruments, binned at a 50-s resolution. Intervals that visually resemble low-mode episodes are highlighted in yellow. However, the lack of a clear bimodal distribution in the count rates (bottom panel of Fig. 5) prevents us from drawing firm conclusions. The estimated upper limit on the distance of IGR J17511−3057 is 6.9 kpc, notably larger than those of confirmed tMSPs that have exhibited prolonged subluminous disk states, namely PSR J1023+0038 and XSS J12270−4859 (both at ∼1.4 kpc; Deller et al. 2012; de Martino et al. 2020). Most tMSP candidates with clear bimodality are located within ∼4 kpc (Coti Zelati et al. 2019, 2024; Bogdanov & Halpern 2015; Bogdanov 2016; Gusinskaia et al. 2025; Illiano et al. 2025), whereas more distant systems, such as 4FGL J0407.7−5702 (6.9–12.5 kpc; Miller et al. 2020) and 4FGL J0639.1−8009 (6.6–13.3 kpc; Kyer et al. 2025), display weaker or absent low-mode activity despite other tMSP-like characteristics. A similar large distance (∼8 kpc) is estimated for the AMSP IGR J17379−3747, for which low-luminosity X-ray pulsations have been observed (Bult et al. 2019a). This supports the possibility that short-lived subluminous disk states may remain undetected in more distant systems, as larger distances reduce the signal-to-noise ratio. In addition, intrinsic factors such as system geometry and mass transfer rate may affect the strength of mode switches and therefore their detectability.
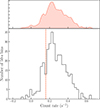 |
Fig. 5. Distribution of count rates obtained from the background-subtracted EPIC light curve (Fig. 4), binned with a time resolution of 50 s. A potential “transition” threshold between high and low modes is indicated by a dashed orange line. Negative count rates can occur in bins where the source signal is very low or absent and the background dominates, as a result of the background subtraction. The upper panels display the Kernel Density Estimation curve, providing a smoothed representation of the count rate distribution. |
The average X-ray spectrum of tMSPs in the subluminous disk state is usually well described by an absorbed power-law with a photon index of Γ ∼ 1.4 − 1.7 (see Papitto & de Martino 2022, and references therein), occasionally softening to Γ ≃ 2 during low modes (Campana et al. 2016; Coti Zelati et al. 2018). For IGR J17511−3057, the photon index at the onset of the 2025 outburst was Γ ≃ 1.7 − 1.8, while the subsequent low-luminosity XMM-Newton/EPIC spectrum was significantly softer (Γ ≃ 2.2; see also Sect. 4.1). Although this value is higher than typically observed in tMSPs in the subluminous disk state, a similar spectral softening was reported for the tMSP IGR J18245−2452 (Linares et al. 2013) and for the AMSP IGR J17379−3747 (Bult et al. 2019a).
During the 2009 outburst, IGR J17511−3057 showed a clear energy dependence of the pulsed signal (see Sect. 4.1), with the first harmonic amplitude increasing with energy up to ∼3–6 keV (Papitto et al. 2010). A similar behavior was reported during the 2025 outburst with NICER and NuSTAR (Sanna et al. 2025). However, our XMM-Newton observation during the subsequent low-luminosity phase in 2025 shows that pulsations were significantly detected only at low energies, with the highest amplitude in the 0.3–3 keV range, and no detection above 3σ at higher energies (Table 2). This soft energy dependence differs from the trend observed in the tMSP PSR J1023+0038 during the subluminous disk state, where the pulsed amplitude increases with energy from optical to X-rays (Papitto et al. 2019; Miraval Zanon et al. 2022; Baglio et al. 2025).
Despite this discrepancy, the overall phenomenology of IGR J17511−3057 in its faint accretion state – characterized by coherent X-ray pulsations, low X-ray luminosity, and spectral softening – shares similarities with the subluminous disk state of tMSPs. Overall, the results presented in this paper not only challenge the traditional boundary between the accretion and propeller regimes, but also blur the distinction between the late stages of X-ray outbursts in some AMSPs and the intermediate subluminous disk state of tMSPs.
4.3. Radio observations
Motivated by the possibility that IGR J17511−3057 might produce radio continuum emission associated with residual accretion or weak outflows, we conducted radio observation of IGR J17511−3057 with ATCA on 2025 April 12. This followed a drop in accretion activity, as indicated by NICER data from 2025 March 15, which showed an average count rate of ∼1 cts s−1 – significantly lower than the 52 cts s−1 observed at the outburst peak (see Sect. 2.2) – and revealed no significant X-ray pulsations, although this may also be due to the limited sensitivity (see Sect. 3.2.2). However, Chandra data during quiescence in 2019 revealed a very low X-ray luminosity (LX, q ∼ 2 × 1032 erg s−1 in the 0.5–10 keV band), over an order of magnitude below that during the XMM-Newton and NICER observations, suggesting that the source may still have been in a faint accretion state during ATCA observations. We did not identify any radio counterpart, with a 3σ upper limit of 60 μJy beam−1 at 5.5 GHz on the total source flux density.
Radio continuum emission has been detected in only a few AMSPs during their X-ray outburst, where it is interpreted as synchrotron radiation from compact, partially self-absorbed jets (e.g., Gaensler et al. 1999; Tudor et al. 2017, and references therein). The first detection was obtained from the first discovered and best-studied AMSP SAX J1808.4−3658, with flux densities of ∼0.8 mJy at 4.8 GHz during its 1998 outburst with no further detection at later epochs, showing a variable behavior (Gaensler et al. 1999). Similar detections were reported for XTE J0929−314 at ∼0.3 mJy at 4.86 GHz (Rupen et al. 2002) and for IGR J00291+5934, which displayed variable radio emission during its 2004 outburst, with flux densities ranging from ∼1.1 mJy (15 GHz) to ∼0.17–0.25 mJy (4.86–5 GHz), while it was not detected during its 2008 outburst, with upper limits of ∼0.16 mJy at 5 GHz (e.g., Lewis et al. 2010), and references therein). A bright transient radio counterpart was also detected for the tMSP IGR J18245−2452 during its 2013 accretion outburst, with flux densities of ∼0.6 mJy and ∼0.8 mJy at 5.5 and 9 GHz, respectively (Pavan et al. 2013). In contrast, several AMSPs such as HETE J1900.1−2455, Swift J1756.9−2508, yielded no radio detections despite searches during their outburst (see Patruno & Watts 2021, and references therein).
In light of the comparison between IGR J17511−3057 and the tMSPs in the subluminous disk state (Sect. 4.2), we note that the radio emission in the latter sources is attributed to synchrotron-emitting outflows. The prototype of tMSP in the subluminous disk state, PSR J1023+0038, shows a highly variable, flat-spectrum radio emission (Deller et al. 2015; Bogdanov et al. 2015), with an average flux density of ∼56 μJy at 10 GHz during the X-ray high modes, and short-lived flares reaching up to an average radio flux density ∼235 μJy at 10 GHz during the low modes (Bogdanov et al. 2018; see also Baglio et al. 2023). Hints for a similar anticorrelated radio/X-ray variability pattern were recently found for the promising candidate tMSP 3FGL J1544.6−1125 (Gusinskaia et al. 2025), along with remarkably variable radio flux densities ranging from < 13.8 (at 3σ confidence level) to ∼48 μJy in the X-band (8–12 GHz) (Jaodand et al. 2021a), and from ∼29 to 57 μJy in the C-band (4–8 GHz) during X-ray low modes (Gusinskaia et al. 2025), with a 3σ upper limit of ∼8 μJy in the same band at a later epoch despite a nearly constant X-ray flux (Illiano et al. 2025).
Given the estimated source’s distance, the 3σ upper limit of 60 μJy beam−1 at 5.5 GHz obtained for IGR J17511−3057 is not stringent enough to rule out the presence of a radio counterpart when compared with the radio flux densities observed from AMSPs during outburst or from tMSPs in the subluminous disk state. Deeper and more sensitive observations will therefore be needed to probe weaker or variable radio emission and to search for possible coherent pulsations. Interferometric radio observations, such as those performed with ATCA, cannot indeed resolve the individual pulses typical of most radio MSPs, which are characterized by low duty cycles and narrow pulse widths (e.g., Manchester et al. 2005). Future time-resolved radio monitoring will be crucial to distinguish between a quiescent AMSP potentially hosting an active radio pulsar – as observed for the tMSP IGR J18245−2452 (Papitto et al. 2013), and suggested by indirect evidence such as the long-term spin-down observed in many AMSPs (e.g., Illiano et al. 2023b, and references therein) – and a tMSP-like subluminous disk state in IGR J17511−3057.
5. Conclusions
In this paper, we report on XMM-Newton and NICER observations of the AMSP IGR J17511−3057 during the late stage of its 2025 outburst, complemented by archival 2019 Chandra data during quiescence and recent ATCA radio observations. Our main findings can be summarized as follows:
-
Low-luminosity pulsations: coherent X-ray pulsations were detected with XMM-Newton at an unabsorbed flux of ∼1.2 × 10⁻¹² erg cm−2 s−1 (0.5–10 keV), implying an X-ray luminosity of ∼7 × 1033 erg s−1 (assuming a distance equal to the estimated upper limit of 6.9 kpc). At this luminosity, the source is expected to be in the propeller regime, yet pulsations persist. No significant pulsations were detected in subsequent NICER observations, likely due to sensitivity limits and/or decreased accretion activity.
-
High pulse amplitude: the X-ray pulsations reached a peak amplitude of ∼42% in the 0.3–3 keV band. Similar high pulse amplitudes were reported for the AMSP IGR J17379−3747, which also exhibited low-luminosity X-ray pulsations (Bult et al. 2019a). The high pulse amplitude is likely due to a favorable geometric configuration, enabling the detection of X-ray pulsations even beyond the traditional accretion–propeller boundary.
-
Spectral softening: Compared to earlier outburst phases (Sanna et al. 2025), the XMM-Newton spectrum showed significant spectral softening, consistent with trends seen in both NS and black hole binaries toward the end of the outburst. Similar behavior was also observed at the end of the 2013 outburst of the tMSP IGR J18245−2452 (Linares et al. 2013).
-
X-ray quiescent luminosity: The 2019 Chandra spectrum, well described by an absorbed power-law model, revealed a quiescent unabsorbed flux of ∼4 × 10⁻¹⁴ erg cm−2 s−1 (0.5–10 keV), corresponding to a quiescent X-ray luminosity of ∼2 × 1032 erg s−1 (for d < 6.9 kpc). The XMM-Newton luminosity was thus more than an order of magnitude higher than quiescence.
-
Comparison with tMSPs: The low-luminosity pulsations and spectral softening are reminiscent of tMSPs in the subluminous disk state, where X-ray, optical, and UV pulsations are thought to originate from synchrotron emission at the pulsar wind–disk boundary rather than direct accretion. While this seems a viable option, some key differences remain, such as the lack of a clear bimodality in the X-ray count distribution and the energy dependence of pulsations.
-
Radio non-detection: We did not detect a radio counterpart during ATCA observations, with a 3σ upper limit of 60 μJy beam−1 at 5.5 GHz on the flux density. Such a limit remains compatible with the radio flux densities observed from AMSPs during outburst and from tMSPs in the subluminous disk state, and therefore cannot rule out the presence of a faint or variable radio counterpart. Future time-resolved radio monitoring will also be essential to distinguish between a quiescent AMSP potentially hosting an active radio pulsar and a tMSP-like subluminous disk state in IGR J17511−3057.
Acknowledgments
We thank the referee for useful comments. We thank Vito Sguera for the helpful discussions during the outburst. This work is based on observations obtained with XMM-Newton, an ESA science mission with instruments and contributions directly funded by ESA Member States and NASA. We are grateful to the XMM-Newton director for scheduling ToO observations in Director’s Discretionary Time. The Australia Telescope Compact Array is part of the Australia Telescope National Facility (https://ror.org/05qajvd42), which is funded by the Australian Government for operation as a National Facility managed by CSIRO. We acknowledge the Gomeroi people as the Traditional Owners of the ATCA observatory site. AP acknowledges support by INAF (Research Grant FANS and PULSE-X, PI: Papitto), the Italian Ministry of University and Research (PRIN MUR 2020, Grant 2020BRP57Z, GEMS, PI: Astone), and Fondazione Cariplo/Cassa Depositi e Prestiti (Grant 2023-2560, PI: Papitto). FCZ is supported by a Ramon y Cajal fellowship (grant agreement RYC2021-030888-I). AM and FCZ are also supported by the National Spanish grant PID2023-153099NA-I00.
References
- Allen, J. L., Linares, M., Homan, J., & Chakrabarty, D. 2015, ApJ, 801, 10 [Google Scholar]
- Alpar, M. A., Cheng, A. F., Ruderman, M. A., & Shaham, J. 1982, Nature, 300, 728 [NASA ADS] [CrossRef] [Google Scholar]
- Altamirano, D., Watts, A., Linares, M., et al. 2010, MNRAS, 409, 1136 [Google Scholar]
- Altamirano, D., Cavecchi, Y., Patruno, A., et al. 2011, ApJ, 727, L18 [NASA ADS] [CrossRef] [Google Scholar]
- Ambrosino, F., Papitto, A., Stella, L., et al. 2017, Nat. Astron., 1, 854 [NASA ADS] [CrossRef] [Google Scholar]
- Archibald, A. M., Stairs, I. H., Ransom, S. M., et al. 2009, Science, 324, 1411 [Google Scholar]
- Archibald, A. M., Bogdanov, S., Patruno, A., et al. 2015, ApJ, 807, 62 [NASA ADS] [CrossRef] [Google Scholar]
- Arnaud, K. A. 1996, in Astronomical Data Analysis Software and Systems V, eds. G. H. Jacoby, & J. Barnes, ASP Conf. Ser., 101, 17 [NASA ADS] [Google Scholar]
- Baglio, M. C., Coti Zelati, F., Campana, S., et al. 2023, A&A, 677, A30 [NASA ADS] [CrossRef] [EDP Sciences] [Google Scholar]
- Baglio, M. C., Coti Zelati, F., Di Marco, A., et al. 2025, ApJ, 987, L19 [Google Scholar]
- Baldovin, C., Kuulkers, E., Ferrigno, C., et al. 2009, ATel, 2196, 1 [NASA ADS] [Google Scholar]
- Ballocco, C., Papitto, A., Miraval Zanon, A., et al. 2026, A&A, in press, https://doi.org/10.1051/0004-6361/202556075 [Google Scholar]
- Bogdanov, S. 2016, ApJ, 826, 28 [NASA ADS] [CrossRef] [Google Scholar]
- Bogdanov, S., & Halpern, J. P. 2015, ApJ, 803, L27 [NASA ADS] [CrossRef] [Google Scholar]
- Bogdanov, S., Archibald, A. M., Bassa, C., et al. 2015, ApJ, 806, 148 [NASA ADS] [CrossRef] [Google Scholar]
- Bogdanov, S., Deller, A. T., Miller-Jones, J. C. A., et al. 2018, ApJ, 856, 54 [NASA ADS] [CrossRef] [Google Scholar]
- Bozzo, E., Ferrigno, C., Falanga, M., et al. 2010, A&A, 509, L3 [NASA ADS] [CrossRef] [EDP Sciences] [Google Scholar]
- Bozzo, E., Kuulkers, E., Bazzano, A., et al. 2015, ATel, 7275, 1 [NASA ADS] [Google Scholar]
- Brown, E. F., Bildsten, L., & Rutledge, R. E. 1998, ApJ, 504, L95 [NASA ADS] [CrossRef] [Google Scholar]
- Buccheri, R., Bennett, K., Bignami, G. F., et al. 1983, A&A, 128, 245 [NASA ADS] [Google Scholar]
- Bult, P., Markwardt, C. B., Altamirano, D., et al. 2019a, ApJ, 877, 70 [Google Scholar]
- Bult, P. M., Gendreau, K. C., Arzoumanian, Z., et al. 2019b, ATel, 13001, 1 [Google Scholar]
- Bult, P., Chakrabarty, D., Arzoumanian, Z., et al. 2020, ApJ, 898, 38 [CrossRef] [Google Scholar]
- Caliandro, G. A., Torres, D. F., & Rea, N. 2012, MNRAS, 427, 2251 [NASA ADS] [CrossRef] [Google Scholar]
- Campana, S., & Di Salvo, T. 2018, in Astrophysics and Space Science Library, eds. L. Rezzolla, P. Pizzochero, D. I. Jones, N. Rea, & I. Vidaña, Astrophys. Space Sci. Lib., 457, 149 [NASA ADS] [CrossRef] [Google Scholar]
- Campana, S., Colpi, M., Mereghetti, S., Stella, L., & Tavani, M. 1998, A&A Rev., 8, 279 [Google Scholar]
- Campana, S., Coti Zelati, F., Papitto, A., et al. 2016, A&A, 594, A31 [NASA ADS] [CrossRef] [EDP Sciences] [Google Scholar]
- Campana, S., Stella, L., Mereghetti, S., & de Martino, D. 2018, A&A, 610, A46 [NASA ADS] [CrossRef] [EDP Sciences] [Google Scholar]
- CASA Team, Bean, B., Bhatnagar, S., et al. 2022, PASP, 134, 114501 [NASA ADS] [CrossRef] [Google Scholar]
- Cash, W. 1979, ApJ, 228, 939 [Google Scholar]
- Coti Zelati, F., Campana, S., Braito, V., et al. 2018, A&A, 611, A14 [NASA ADS] [CrossRef] [EDP Sciences] [Google Scholar]
- Coti Zelati, F., Papitto, A., de Martino, D., et al. 2019, A&A, 622, A211 [NASA ADS] [CrossRef] [EDP Sciences] [Google Scholar]
- Coti Zelati, F., de Martino, D., Dhillon, V. S., et al. 2024, A&A, 690, A220 [NASA ADS] [CrossRef] [EDP Sciences] [Google Scholar]
- D’Angelo, C. R., & Spruit, H. C. 2010, MNRAS, 406, 1208 [NASA ADS] [Google Scholar]
- D’Angelo, C. R., & Spruit, H. C. 2012, MNRAS, 420, 416 [Google Scholar]
- Das, P., Salmi, T., Davelaar, J., Porth, O., & Watts, A. 2025, ApJ, 987, 34 [Google Scholar]
- de Jager, O. C., & Büsching, I. 2010, A&A, 517, L9 [NASA ADS] [CrossRef] [EDP Sciences] [Google Scholar]
- de Martino, D., Papitto, A., Burgay, M., et al. 2020, MNRAS, 492, 5607 [Google Scholar]
- Deller, A. T., Archibald, A. M., Brisken, W. F., et al. 2012, ApJ, 756, L25 [NASA ADS] [CrossRef] [Google Scholar]
- Deller, A. T., Moldon, J., Miller-Jones, J. C. A., et al. 2015, ApJ, 809, 13 [NASA ADS] [CrossRef] [Google Scholar]
- Di Salvo, T., & Sanna, A. 2022, in Astrophysics and Space Science Library, eds. S. Bhattacharyya, A. Papitto, & D. Bhattacharya, Astrophys. Space Sci. Lib., 465, 87 [NASA ADS] [CrossRef] [Google Scholar]
- Di Salvo, T., Papitto, A., Marino, A., Iaria, R., & Burderi, L. 2023, in Handbook of X-ray and Gamma-ray Astrophysics, ed. C. Bambi, 147 [Google Scholar]
- Falanga, M., Kuiper, L., Poutanen, J., et al. 2011, A&A, 529, A68 [NASA ADS] [CrossRef] [EDP Sciences] [Google Scholar]
- Fruscione, A., McDowell, J. C., Allen, G. E., et al. 2006, in Observatory Operations: Strategies, Processes, and Systems, eds. D. R. Silva, & R. E. Doxsey, SPIE Conf. Ser., 6270, 62701V [NASA ADS] [CrossRef] [Google Scholar]
- Gaensler, B. M., Stappers, B. W., & Getts, T. J. 1999, ApJ, 522, L117 [Google Scholar]
- Galloway, D. K., & Cumming, A. 2006, ApJ, 652, 559 [Google Scholar]
- Galloway, D. K., Goodwin, A. J., Hilder, T., Waterson, L., & Cupák, M. 2024, MNRAS, 535, 647 [Google Scholar]
- Garmire, G. P., Bautz, M. W., Ford, P. G., Nousek, J. A., & Ricker, Jr., G. R. 2003, in X-Ray and Gamma-Ray Telescopes and Instruments for Astronomy, eds. J. E. Truemper, & H. D. Tananbaum, SPIE Conf. Ser., 4851, 28 [NASA ADS] [Google Scholar]
- Gendreau, K. C., Arzoumanian, Z., & Okajima, T. 2012, in Space Telescopes and Instrumentation 2012: Ultraviolet to Gamma Ray, eds. T. Takahashi, S. S. Murray, & J. W. A. den Herder, SPIE Conf. Ser., 8443, 844313 [Google Scholar]
- Ghosh, P., & Lamb, F. K. 1979, ApJ, 232, 259 [Google Scholar]
- Gusinskaia, N. V., Jaodand, A. D., Hessels, J. W. T., et al. 2025, MNRAS, 536, 99 [Google Scholar]
- Hartman, J. M., Patruno, A., Chakrabarty, D., et al. 2008, ApJ, 675, 1468 [NASA ADS] [CrossRef] [Google Scholar]
- Hartman, J. M., Patruno, A., Chakrabarty, D., et al. 2009, ApJ, 702, 1673 [NASA ADS] [CrossRef] [Google Scholar]
- Illarionov, A. F., & Sunyaev, R. A. 1975, A&A, 39, 185 [NASA ADS] [Google Scholar]
- Illiano, G., Papitto, A., Ambrosino, F., et al. 2023a, A&A, 669, A26 [NASA ADS] [CrossRef] [EDP Sciences] [Google Scholar]
- Illiano, G., Papitto, A., Sanna, A., et al. 2023b, ApJ, 942, L40 [NASA ADS] [CrossRef] [Google Scholar]
- Illiano, G., Coti Zelati, F., Miraval Zanon, A., et al. 2025, A&A, 700, A130 [NASA ADS] [CrossRef] [EDP Sciences] [Google Scholar]
- Jansen, F., Lumb, D., Altieri, B., et al. 2001, A&A, 365, L1 [NASA ADS] [CrossRef] [EDP Sciences] [Google Scholar]
- Jaodand, A. D., Deller, A. T., Gusinskaia, N., et al. 2021a, ApJ, 923, 3 [NASA ADS] [CrossRef] [Google Scholar]
- Jaodand, A. D., Hernández Santisteban, J. V., Archibald, A. M., et al. 2021b, arXiv e-prints [arXiv:2102.13145] [Google Scholar]
- Kaastra, J. S., & Bleeker, J. A. M. 2016, A&A, 587, A151 [NASA ADS] [CrossRef] [EDP Sciences] [Google Scholar]
- Kirsch, M. G., Briel, U. G., Burrows, D., et al. 2005, in UV, X-Ray, and Gamma-Ray Space Instrumentation for Astronomy XIV, ed. O. H. W. Siegmund, SPIE Conf. Ser., 5898, 22 [NASA ADS] [Google Scholar]
- Kyer, R., Roy, S., Strader, J., et al. 2025, ApJ, 983, 112 [Google Scholar]
- Leahy, D. A. 1987, A&A, 180, 275 [NASA ADS] [Google Scholar]
- Leahy, D. A., Darbro, W., Elsner, R. F., et al. 1983, ApJ, 266, 160 [NASA ADS] [CrossRef] [Google Scholar]
- Lewis, F., Russell, D. M., Jonker, P. G., et al. 2010, A&A, 517, A72 [NASA ADS] [CrossRef] [EDP Sciences] [Google Scholar]
- Linares, M. 2014, ApJ, 795, 72 [NASA ADS] [CrossRef] [Google Scholar]
- Linares, M., Bahramian, A., Heinke, C., et al. 2013, MNRAS, 438, 251 [Google Scholar]
- Manchester, R. N., Hobbs, G. B., Teoh, A., & Hobbs, M. 2005, AJ, 129, 1993 [Google Scholar]
- Marino, A., Anitra, A., Mazzola, S. M., et al. 2022, MNRAS, 515, 3838 [CrossRef] [Google Scholar]
- Markwardt, C. B., Altamirano, D., Strohmayer, T. E., & Swank, J. H. 2009a, ATel, 2237, 1 [Google Scholar]
- Markwardt, C. B., Altamirano, D., Swank, J. H., et al. 2009b, ATel, 2197, 1 [NASA ADS] [Google Scholar]
- Miller, J. M., Swihart, S. J., Strader, J., et al. 2020, ApJ, 904, 49 [NASA ADS] [CrossRef] [Google Scholar]
- Miraval Zanon, A., Ambrosino, F., Coti Zelati, F., et al. 2022, A&A, 660, A63 [NASA ADS] [CrossRef] [EDP Sciences] [Google Scholar]
- Ng, M., Boztepe, T., Sanna, A., et al. 2025, ATel, 17032, 1 [Google Scholar]
- Paizis, A., Nowak, M. A., Rodriguez, J., et al. 2012, ApJ, 755, 52 [Google Scholar]
- Pallanca, C., Dalessandro, E., Ferraro, F. R., Lanzoni, B., & Beccari, G. 2013, ApJ, 773, 122 [NASA ADS] [CrossRef] [Google Scholar]
- Papitto, A., & de Martino, D. 2022, in Astrophysics and Space Science Library, eds. S. Bhattacharyya, A. Papitto, & D. Bhattacharya, 465, 157 [NASA ADS] [CrossRef] [Google Scholar]
- Papitto, A., Riggio, A., di Salvo, T., et al. 2010, MNRAS, 407, 2575 [Google Scholar]
- Papitto, A., Ferrigno, C., Bozzo, E., et al. 2013, Nature, 501, 517 [NASA ADS] [CrossRef] [Google Scholar]
- Papitto, A., de Martino, D., Belloni, T. M., et al. 2015, MNRAS, 449, L26 [NASA ADS] [CrossRef] [Google Scholar]
- Papitto, A., Bozzo, E., Sanchez-Fernandez, C., et al. 2016, A&A, 596, A71 [NASA ADS] [CrossRef] [EDP Sciences] [Google Scholar]
- Papitto, A., Ambrosino, F., Stella, L., et al. 2019, ApJ, 882, 104 [NASA ADS] [CrossRef] [Google Scholar]
- Patruno, A., & Watts, A. L. 2021, in Timing Neutron Stars: Pulsations, Oscillations and Explosions, eds. T. M. Belloni, M. Méndez, & C. Zhang, Astrophys. Space Sci. Lib., 461, 143 [NASA ADS] [CrossRef] [Google Scholar]
- Patruno, A., Watts, A., Klein Wolt, M., Wijnands, R., & van der Klis, M. 2009, ApJ, 707, 1296 [Google Scholar]
- Patruno, A., Hartman, J. M., Wijnands, R., Chakrabarty, D., & van der Klis, M. 2010, ApJ, 717, 1253 [NASA ADS] [CrossRef] [Google Scholar]
- Patruno, A., Bult, P., Gopakumar, A., et al. 2012, ApJ, 746, L27 [NASA ADS] [CrossRef] [Google Scholar]
- Patruno, A., Maitra, D., Curran, P. A., et al. 2016, ApJ, 817, 100 [NASA ADS] [CrossRef] [Google Scholar]
- Pavan, L., Wong, G., Wieringa, M. H., et al. 2013, ATel, 4981, 1 [Google Scholar]
- Plotkin, R. M., Gallo, E., & Jonker, P. G. 2013, ApJ, 773, 59 [NASA ADS] [CrossRef] [Google Scholar]
- Poutanen, J., & Beloborodov, A. M. 2006, MNRAS, 373, 836 [NASA ADS] [CrossRef] [Google Scholar]
- Radhakrishnan, V., & Srinivasan, G. 1982, Curr. Sci., 51, 1096 [NASA ADS] [Google Scholar]
- Riggio, A., Papitto, A., Burderi, L., et al. 2011, A&A, 526, A95 [NASA ADS] [CrossRef] [EDP Sciences] [Google Scholar]
- Romanova, M. M., Blinova, A. A., Ustyugova, G. V., Koldoba, A. V., & Lovelace, R. V. E. 2018, New Astron., 62, 94 [Google Scholar]
- Rupen, M. P., Dhawan, V., & Mioduszewski, A. J. 2002, IAU Circ., 7893, 2 [NASA ADS] [Google Scholar]
- Sanna, A., Di Salvo, T., Burderi, L., et al. 2017, MNRAS, 471, 463 [NASA ADS] [CrossRef] [Google Scholar]
- Sanna, A., Bozzo, E., Papitto, A., et al. 2018, A&A, 616, L17 [NASA ADS] [CrossRef] [EDP Sciences] [Google Scholar]
- Sanna, A., Burderi, L., Di Salvo, T., et al. 2022, MNRAS, 514, 4385 [Google Scholar]
- Sanna, A., Jaisawal, G. K., Strohmayer, T. E., et al. 2025, A&A, 703, A171 [NASA ADS] [CrossRef] [EDP Sciences] [Google Scholar]
- Schartel, N., González-Riestra, R., Kretschmar, P., et al. 2022, Handbook of X-ray and Gamma-ray Astrophysics (Springer Living Reference Work), 114 [Google Scholar]
- Sguera, V. 2025a, ATel, 17061, 1 [Google Scholar]
- Sguera, V. 2025b, ATel, 17029, 1 [Google Scholar]
- Spruit, H. C., & Taam, R. E. 1993, ApJ, 402, 593 [CrossRef] [Google Scholar]
- Standish, E. M. 1998, JPL Planetary and Lunar Ephemerides, DE405/LE405, JPL Interoffice Memo 312.F-98-048 (Pasadena, CA: NASA Jet Propulsion Laboratory) [Google Scholar]
- Stappers, B. W., Archibald, A. M., Hessels, J. W. T., et al. 2014, ApJ, 790, 39 [Google Scholar]
- Strüder, L., Briel, U., Dennerl, K., et al. 2001, A&A, 365, L18 [Google Scholar]
- Takata, J., Li, K. L., Leung, G. C. K., et al. 2014, ApJ, 785, 131 [Google Scholar]
- Tendulkar, S. P., Yang, C., An, H., et al. 2014, ApJ, 791, 77 [CrossRef] [Google Scholar]
- Thompson, A. R., Moran, J. M., & Swenson, G. W., Jr 2017, Interferometry and Synthesis in Radio Astronomy, 3rd edn. (Springer) [Google Scholar]
- Torres, D. F., & Li, J. 2022, in Astrophysics and Space Science Library, eds. S. Bhattacharyya, A. Papitto, & D. Bhattacharya, Astrophys. Space Sci. Lib., 465, 33 [NASA ADS] [CrossRef] [Google Scholar]
- Tudor, V., Miller-Jones, J. C. A., Patruno, A., et al. 2017, MNRAS, 470, 324 [Google Scholar]
- Turner, M. J. L., Abbey, A., Arnaud, M., et al. 2001, A&A, 365, L27 [CrossRef] [EDP Sciences] [Google Scholar]
- van der Klis, M. 1988, Timing Neutron Stars, 262, 27 [Google Scholar]
- Vaughan, B. A., van der Klis, M., Wood, K. S., et al. 1994, ApJ, 435, 362 [NASA ADS] [CrossRef] [Google Scholar]
- Veledina, A., Nättilä, J., & Beloborodov, A. M. 2019, ApJ, 884, 144 [CrossRef] [Google Scholar]
- Verner, D. A., Ferland, G. J., Korista, K. T., & Yakovlev, D. G. 1996, ApJ, 465, 487 [Google Scholar]
- Weisskopf, M. C., Tananbaum, H. D., Van Speybroeck, L. P., & O’Dell, S. L. 2000, in X-Ray Optics, Instruments, and Missions III, eds. J. E. Truemper, & B. Aschenbach, SPIE Conf. Ser., 4012, 2 [NASA ADS] [CrossRef] [Google Scholar]
- Wijnands, R., & van der Klis, M. 1998, Nature, 394, 344 [CrossRef] [Google Scholar]
- Wijnands, R., Degenaar, N., Armas Padilla, M., et al. 2015, MNRAS, 454, 1371 [Google Scholar]
- Wilms, J., Allen, A., & McCray, R. 2000, ApJ, 542, 914 [Google Scholar]
- Wu, Q., & Gu, M. 2008, ApJ, 682, 212 [Google Scholar]
- Zdziarski, A. A., Szanecki, M., Poutanen, J., Gierliński, M., & Biernacki, P. 2020, MNRAS, 492, 5234 [NASA ADS] [CrossRef] [Google Scholar]
- Zuo, Z., Cugno, G., Michail, J., et al. 2025, ApJ, 991, 157 [Google Scholar]
In radio interferometry, uv-coverage refers to the sampling of spatial frequencies by the projected baselines between antennas. As the Earth rotates, these projections change, tracing elliptical tracks in the uv-plane and improving image reconstruction. See Thompson et al. (2017) for more details.
The false alarm probability p is defined as 1 − C, where C is the confidence level (e.g., Vaughan et al. 1994).
All Tables
Best-fit spectral parameters from the XMM-Newton observation for the model constant * TBabs * (thComp*bbodyrad).
All Figures
|
Fig. 1. Light curve in the 0.5–10 keV band of the 2025 outburst of IGR J17511−3057 observed by INTEGRAL (blue points for detections, blue downward arrows for 3σ upper limits; Sguera 2025a), NICER (green squares; the first point is from Sanna et al. 2025, while the last point is discussed in Sect. 3.1.2), NuSTAR (orange pentagon; Sanna et al. 2025), and XMM-Newton (red diamond). The times on the x-axis are given in days since 60713 MJD, corresponding to the first INTEGRAL observation reported for this outburst (Sguera 2025a). The associated error bars are not visible, as they are smaller than the size of the data points. The dashed black line indicates the unabsorbed 0.5–10 keV flux of 3.8 × 10⁻¹⁴ erg cm−2 s−1 estimated during quiescence from the 2019 Chandra observation (Sect. 3.1.3). The INTEGRAL 28–60 keV fluxes, initially expressed in mCrab, were converted to the 0.5–10 keV band and reported in CGS units. We assumed the Crab pulsar’s spectral model from Kirsch et al. (2005) (a power law with a photon index Γ = 2.252 and a normalization N = 15.47 absorbed by an equivalent hydrogen column of NH = 0.4 × 1022 cm−2, adopting the interstellar medium abundance and the cross-section tables from Wilms et al. (2000) and Verner et al. (1996), respectively). The spectrum of IGR J17511−3057 was described with an absorbed semiphenomenological Comptonization model with a seed blackbody component as reported in Sanna et al. (2025) (see Model-I for NuSTAR, Table 2). |
| In the text | |
|
Fig. 2. X-ray spectrum of IGR J17511-3057 as observed by XMM-Newton on 2025 March 4 with EPIC-pn (blue), EPIC-MOS1 (orange), and EPIC-MOS2 (green), along with the best-fitting model constant * TBabs * (thComp*bbodyrad) (see Table 1). The bottom panel displays the residuals from the fit. |
| In the text | |
|
Fig. 3. Top panel: Epoch-folding search obtained with 128 trial periods by sampling each period with ten phase bins. The black points represent the resulting χ2 values, while the red line shows the best-fit Gaussian model used to determine the spin period. The indicated x-axis offset corresponds to Ps = 0.0040844008709 s. The inset in the top-right corner shows the corresponding pulse profile using ten phase bins around Ps, with Tref = 60717.7 MJD(TDB) as reference epoch. Bottom panel: H-statistic values as a function of the trial periods, computed using the same grid as in the epoch-folding search. For each trial period, we selected the harmonic number that maximized the H-statistic. The red, pink, and dark blue lines represent the values computed for 1, 2, and 3 harmonic terms, respectively. The remaining harmonics, up to 20 following the recommendation of de Jager & Büsching (2010), are color-coded according to the viridis colormap shown on the right. The inset in the top-right corner shows the corresponding Rayleigh statistics (Zn2; Buccheri et al. 1983) as a function of the trial periods, using the same color scheme. See Sect. 3.2.1 for details. |
| In the text | |
|
Fig. 4. Background-subtracted light curve from the three EPIC instruments over the time interval of simultaneous coverage, binned at a 50-s resolution. The yellow-shaded regions highlight potential low modes (see Sect. 1 for details). Time is expressed in seconds relative to the reference time Tref = 60738.0582657791310339 MJD (TDB). |
| In the text | |
|
Fig. 5. Distribution of count rates obtained from the background-subtracted EPIC light curve (Fig. 4), binned with a time resolution of 50 s. A potential “transition” threshold between high and low modes is indicated by a dashed orange line. Negative count rates can occur in bins where the source signal is very low or absent and the background dominates, as a result of the background subtraction. The upper panels display the Kernel Density Estimation curve, providing a smoothed representation of the count rate distribution. |
| In the text | |
Current usage metrics show cumulative count of Article Views (full-text article views including HTML views, PDF and ePub downloads, according to the available data) and Abstracts Views on Vision4Press platform.
Data correspond to usage on the plateform after 2015. The current usage metrics is available 48-96 hours after online publication and is updated daily on week days.
Initial download of the metrics may take a while.