Fig. 3.
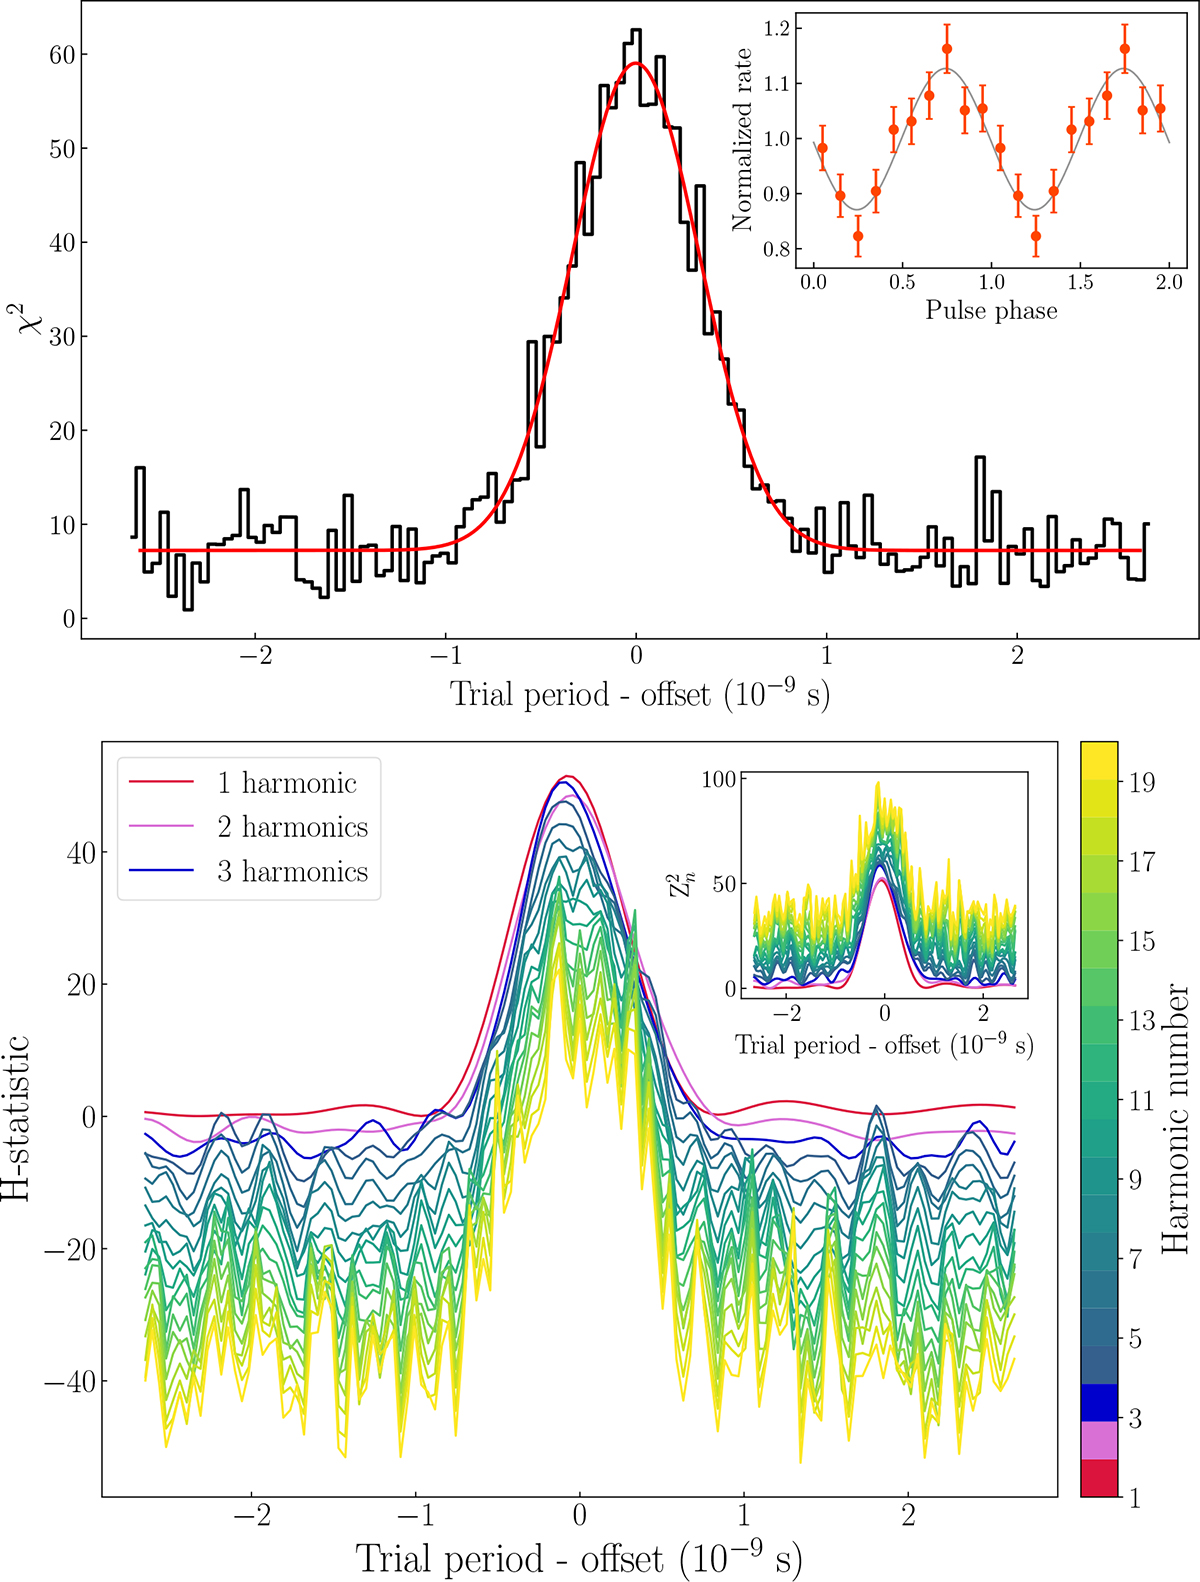
Download original image
Top panel: Epoch-folding search obtained with 128 trial periods by sampling each period with ten phase bins. The black points represent the resulting χ2 values, while the red line shows the best-fit Gaussian model used to determine the spin period. The indicated x-axis offset corresponds to Ps = 0.0040844008709 s. The inset in the top-right corner shows the corresponding pulse profile using ten phase bins around Ps, with Tref = 60717.7 MJD(TDB) as reference epoch. Bottom panel: H-statistic values as a function of the trial periods, computed using the same grid as in the epoch-folding search. For each trial period, we selected the harmonic number that maximized the H-statistic. The red, pink, and dark blue lines represent the values computed for 1, 2, and 3 harmonic terms, respectively. The remaining harmonics, up to 20 following the recommendation of de Jager & Büsching (2010), are color-coded according to the viridis colormap shown on the right. The inset in the top-right corner shows the corresponding Rayleigh statistics (Zn2; Buccheri et al. 1983) as a function of the trial periods, using the same color scheme. See Sect. 3.2.1 for details.
Current usage metrics show cumulative count of Article Views (full-text article views including HTML views, PDF and ePub downloads, according to the available data) and Abstracts Views on Vision4Press platform.
Data correspond to usage on the plateform after 2015. The current usage metrics is available 48-96 hours after online publication and is updated daily on week days.
Initial download of the metrics may take a while.