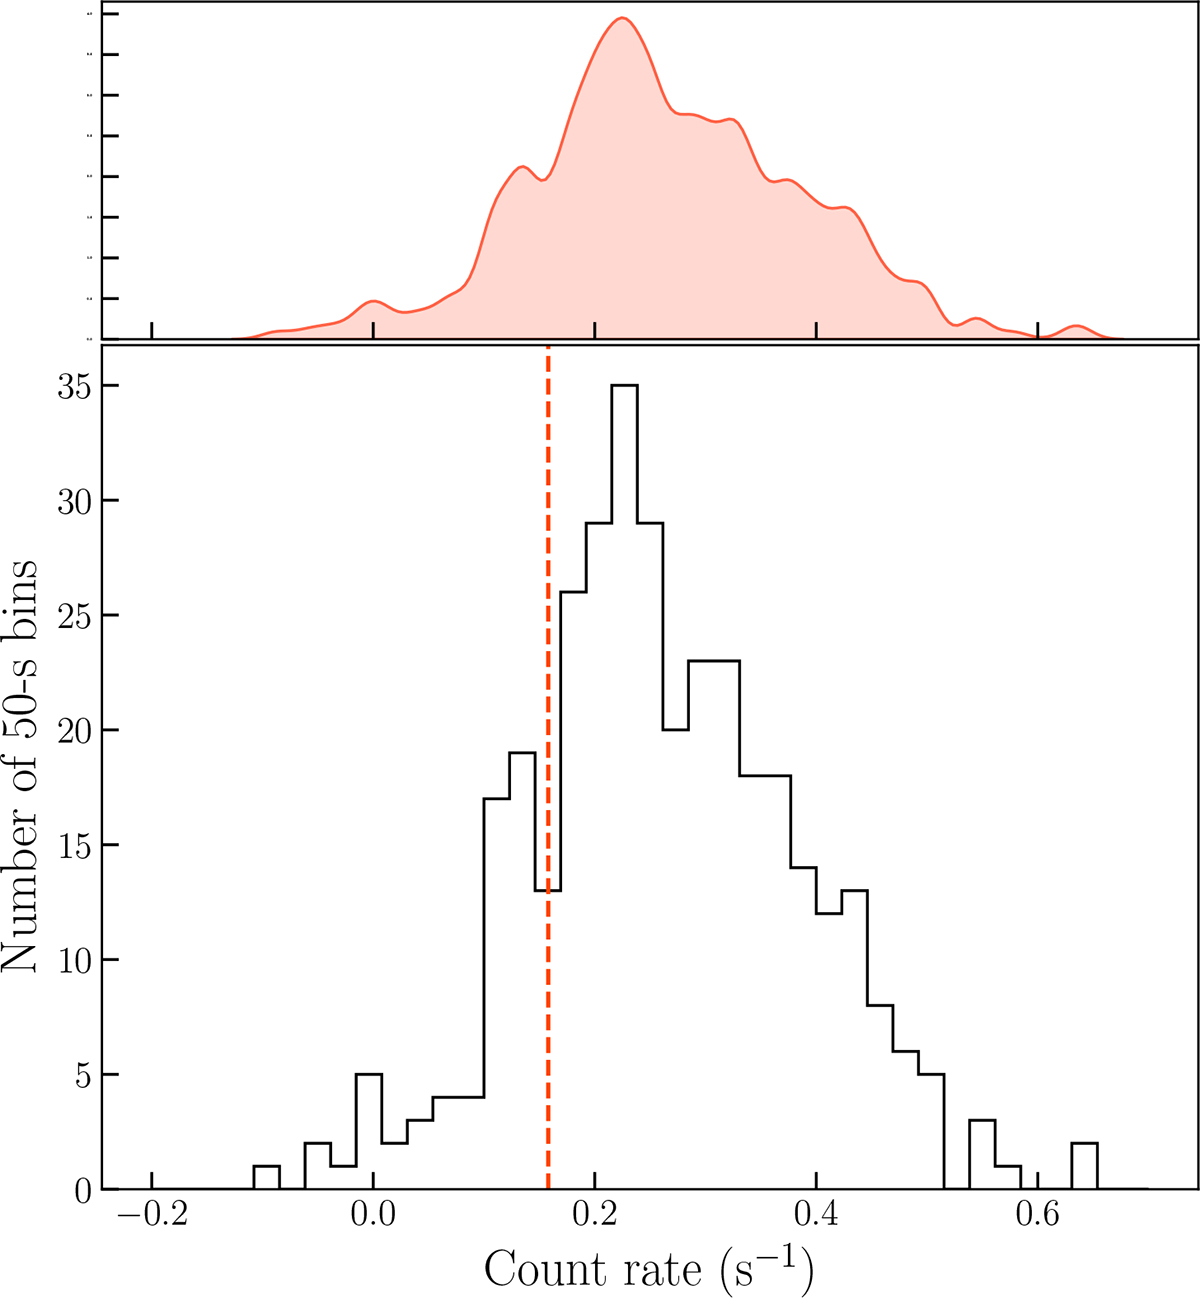
Fig. 5.
Download original image
Distribution of count rates obtained from the background-subtracted EPIC light curve (Fig. 4), binned with a time resolution of 50 s. A potential “transition” threshold between high and low modes is indicated by a dashed orange line. Negative count rates can occur in bins where the source signal is very low or absent and the background dominates, as a result of the background subtraction. The upper panels display the Kernel Density Estimation curve, providing a smoothed representation of the count rate distribution.
Current usage metrics show cumulative count of Article Views (full-text article views including HTML views, PDF and ePub downloads, according to the available data) and Abstracts Views on Vision4Press platform.
Data correspond to usage on the plateform after 2015. The current usage metrics is available 48-96 hours after online publication and is updated daily on week days.
Initial download of the metrics may take a while.