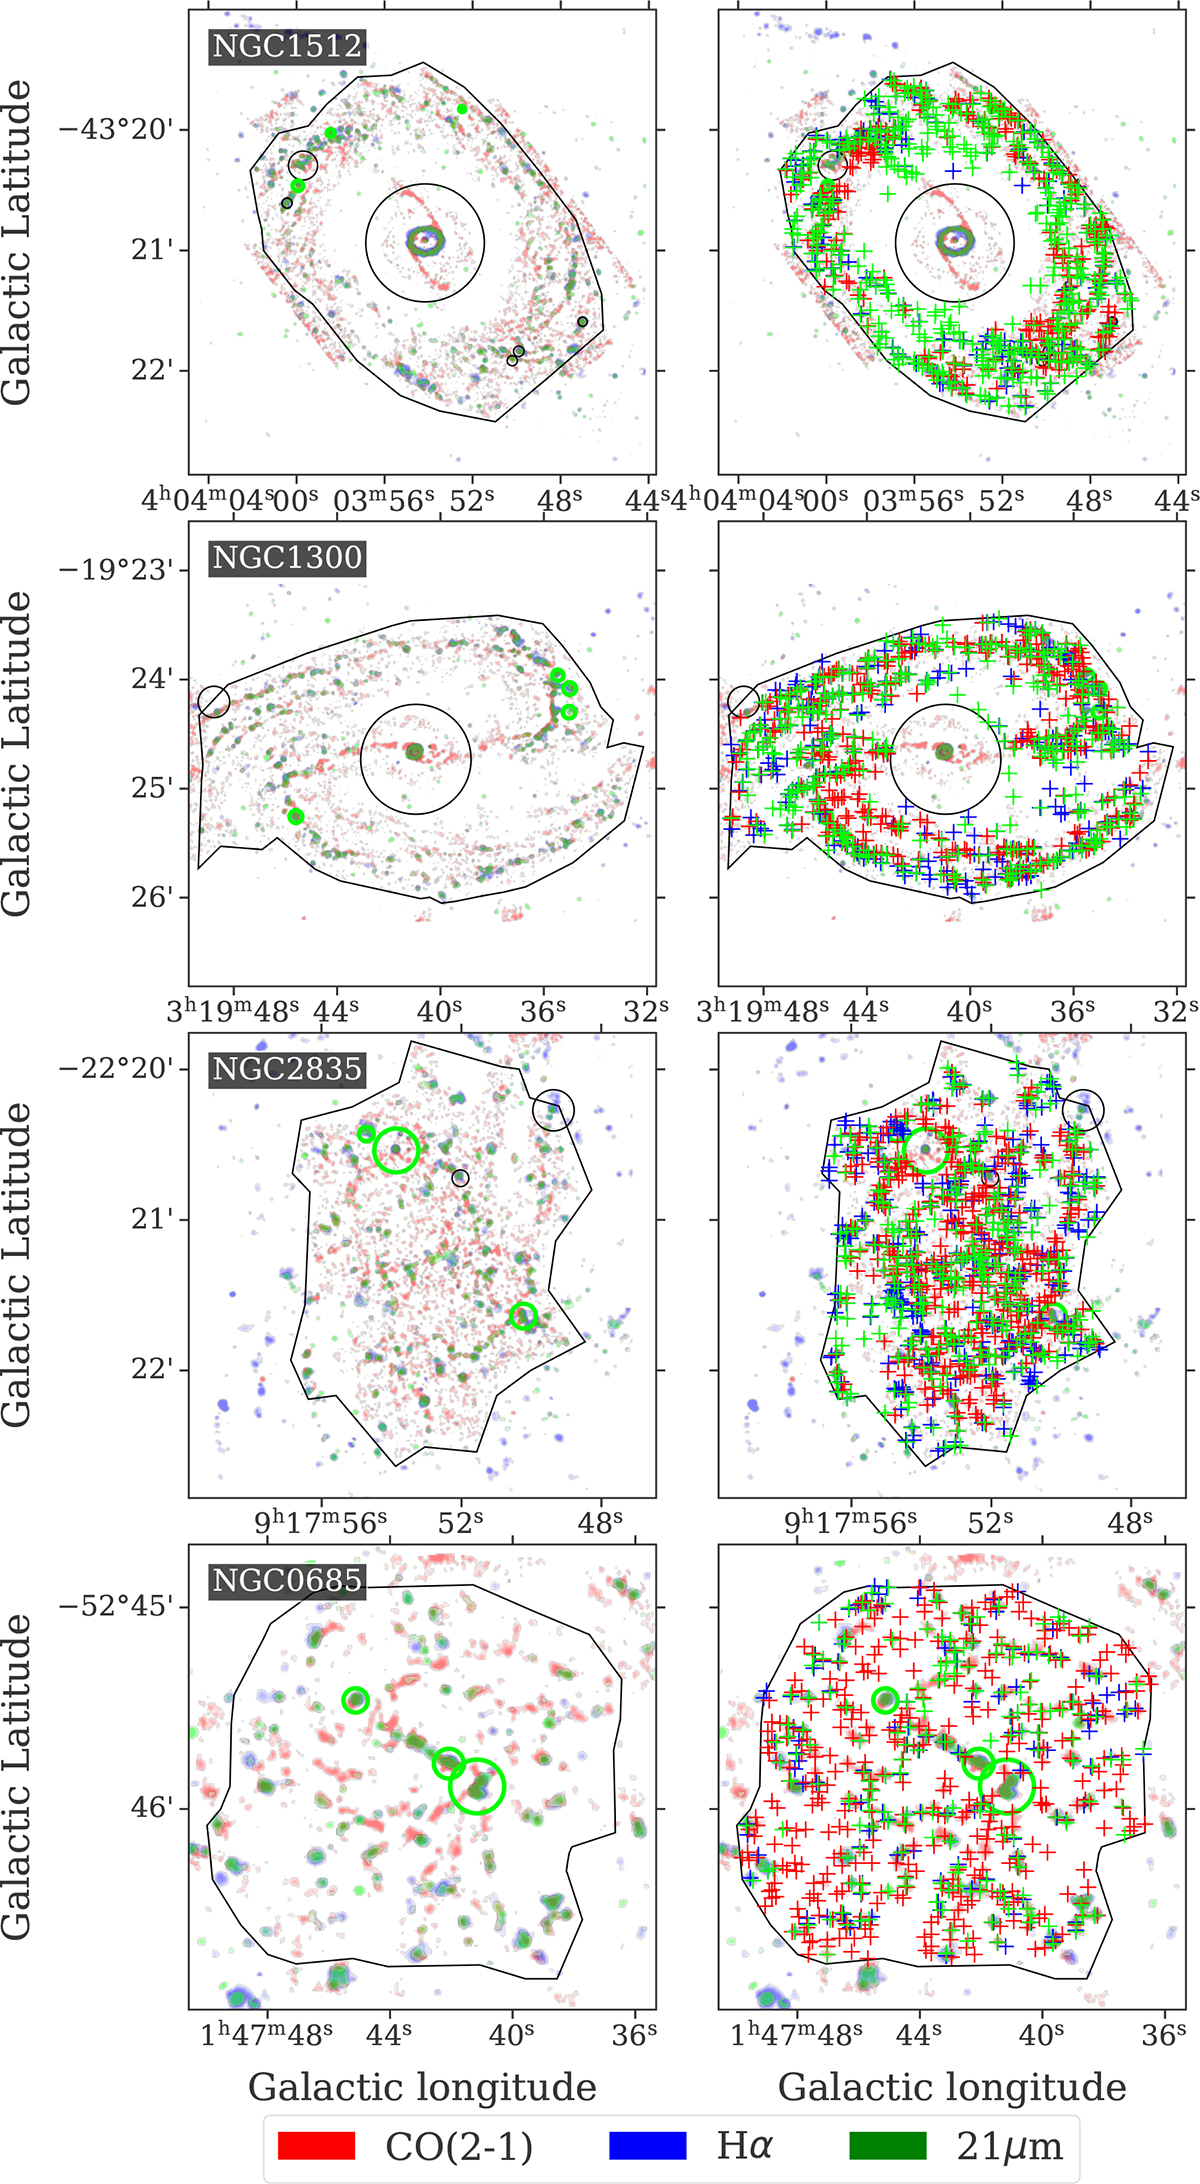
Fig. B.1.
Download original image
Composite image of four galaxies for which robust timescale measurements are derived. The galaxies are ordered following their Hubble morphological T-type from the LEDA database, from massive barred spiral galaxies to low-mass irregular galaxies. The left column shows the compact emission maps obtained after filtering the large scale component. On the right column, the superimposed crosses show the peaks of emission selected by CLUMPFIND (Williams et al. 1994) in each tracer. Isolated 21 μm peaks (green crosses) are identified in the interarm region of barred spiral galaxies, while most 21 μm peaks overlap with CO or Hα peaks in flocculent and irregular galaxies. The black masks show regions which are considered in our analysis, excluding galactic centers, bright peaks of emission, and outer regions where CO is undetected.
Current usage metrics show cumulative count of Article Views (full-text article views including HTML views, PDF and ePub downloads, according to the available data) and Abstracts Views on Vision4Press platform.
Data correspond to usage on the plateform after 2015. The current usage metrics is available 48-96 hours after online publication and is updated daily on week days.
Initial download of the metrics may take a while.