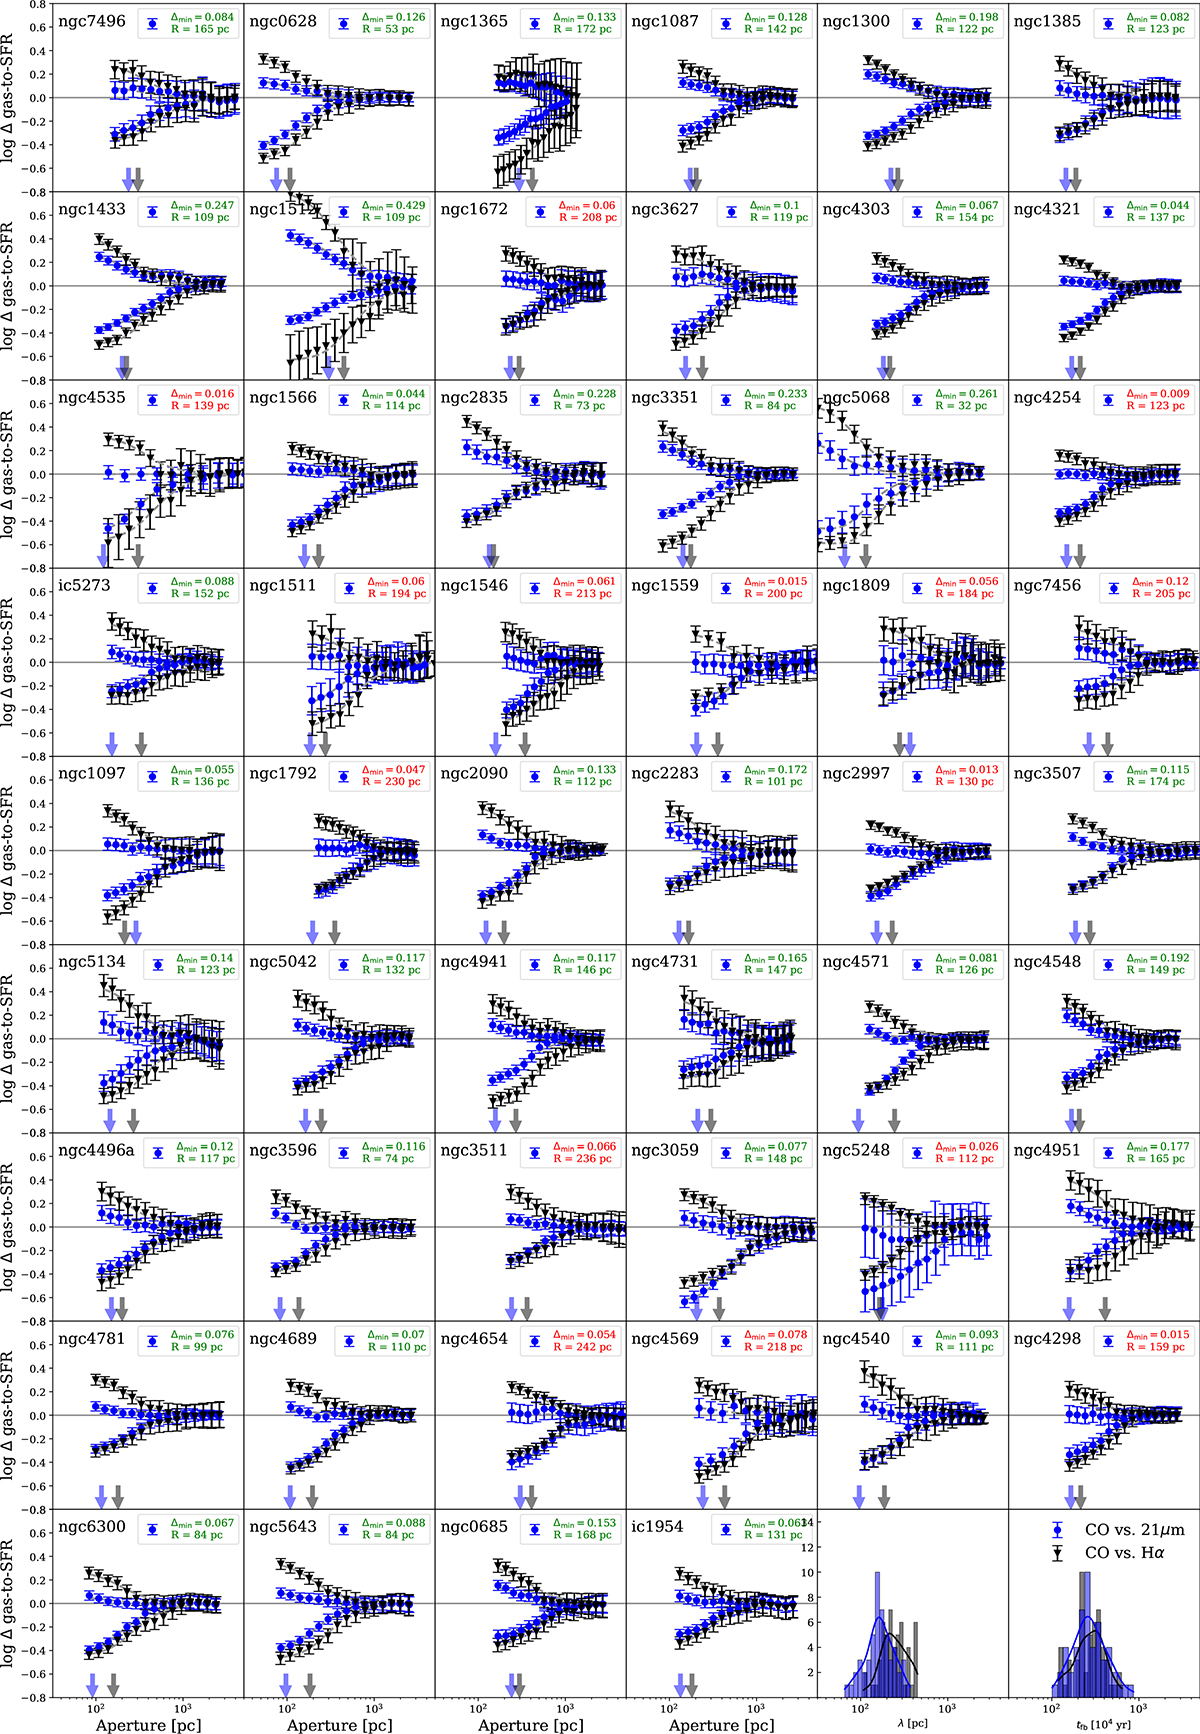
Fig. B.2.
Download original image
Deviation of the 21 μm-to-CO flux ratio (blue) and Hα-to-CO flux ratio (black) with respect to the galactic average as a function of aperture sizes for each galaxy. The arrows indicate the typical separation length, λ, at which the two tracers decorrelate. The amplitude of the decorrelation and the separation length are systematically smaller for CO versus 21 μm runs than for CO versus Hα runs, highlighting the greater overlap between CO and 21 μm. The legends indicate the criteria used to select our final sample: (1) a resolution R ≤ 180 pc (2) a clear decorrelation between CO and 21 μm with Δmin > 0.04 dex.
Current usage metrics show cumulative count of Article Views (full-text article views including HTML views, PDF and ePub downloads, according to the available data) and Abstracts Views on Vision4Press platform.
Data correspond to usage on the plateform after 2015. The current usage metrics is available 48-96 hours after online publication and is updated daily on week days.
Initial download of the metrics may take a while.