Fig. 2.
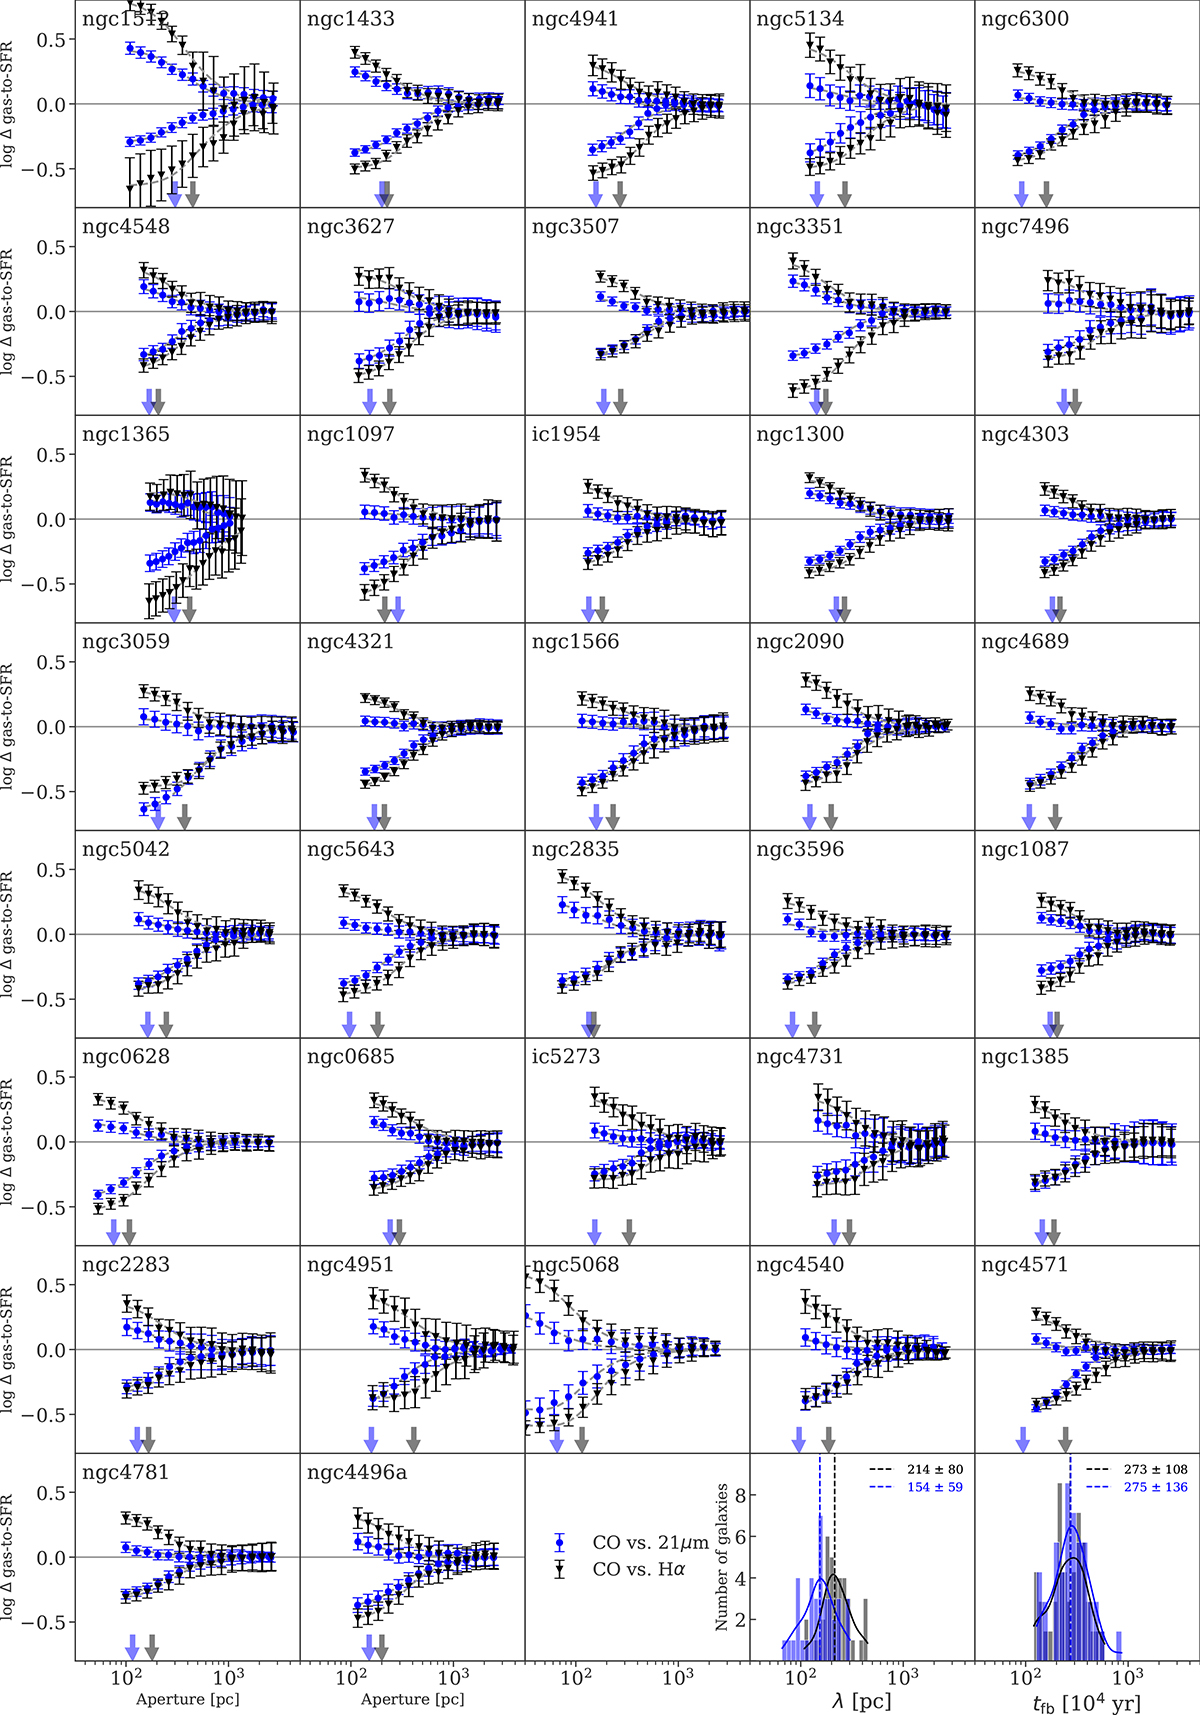
Download original image
Measured deviation of the gas-to-stellar flux ratio with respect to the galactic average as a function of the aperture sizes for each galaxy obtained by contrasting CO emission as a gas tracer respectively with Hα (black triangles) and 21 μm (blue circles) as an SFR tracer. The positive deviations correspond to measurements focusing on gas peaks (traced by CO), while the negative deviations were obtained by focusing on stellar peaks (traced respectively by Hα or 21 μm). For each data point, we also show the effective 1σ error, after the covariance between data points is taken into account. The horizontal plain line corresponding to a deviation of zero in log represents the galactic average. The dotted gray lines connecting the measurements correspond to a polynomial fit of the tuning-fork branches, following Kruijssen et al. (2018). The arrows indicate the typical separation length, λ, at which the two tracers decorrelate. The two last panels show the histograms of λ and inferred feedback timescales (tfb, defined in Section 3.3), derived for the whole sample using either Hα or 21 μm as a proxy for SFR, as well as the median and 1σ standard deviations associated with these distributions.
Current usage metrics show cumulative count of Article Views (full-text article views including HTML views, PDF and ePub downloads, according to the available data) and Abstracts Views on Vision4Press platform.
Data correspond to usage on the plateform after 2015. The current usage metrics is available 48-96 hours after online publication and is updated daily on week days.
Initial download of the metrics may take a while.