Fig. 4.
Download original image
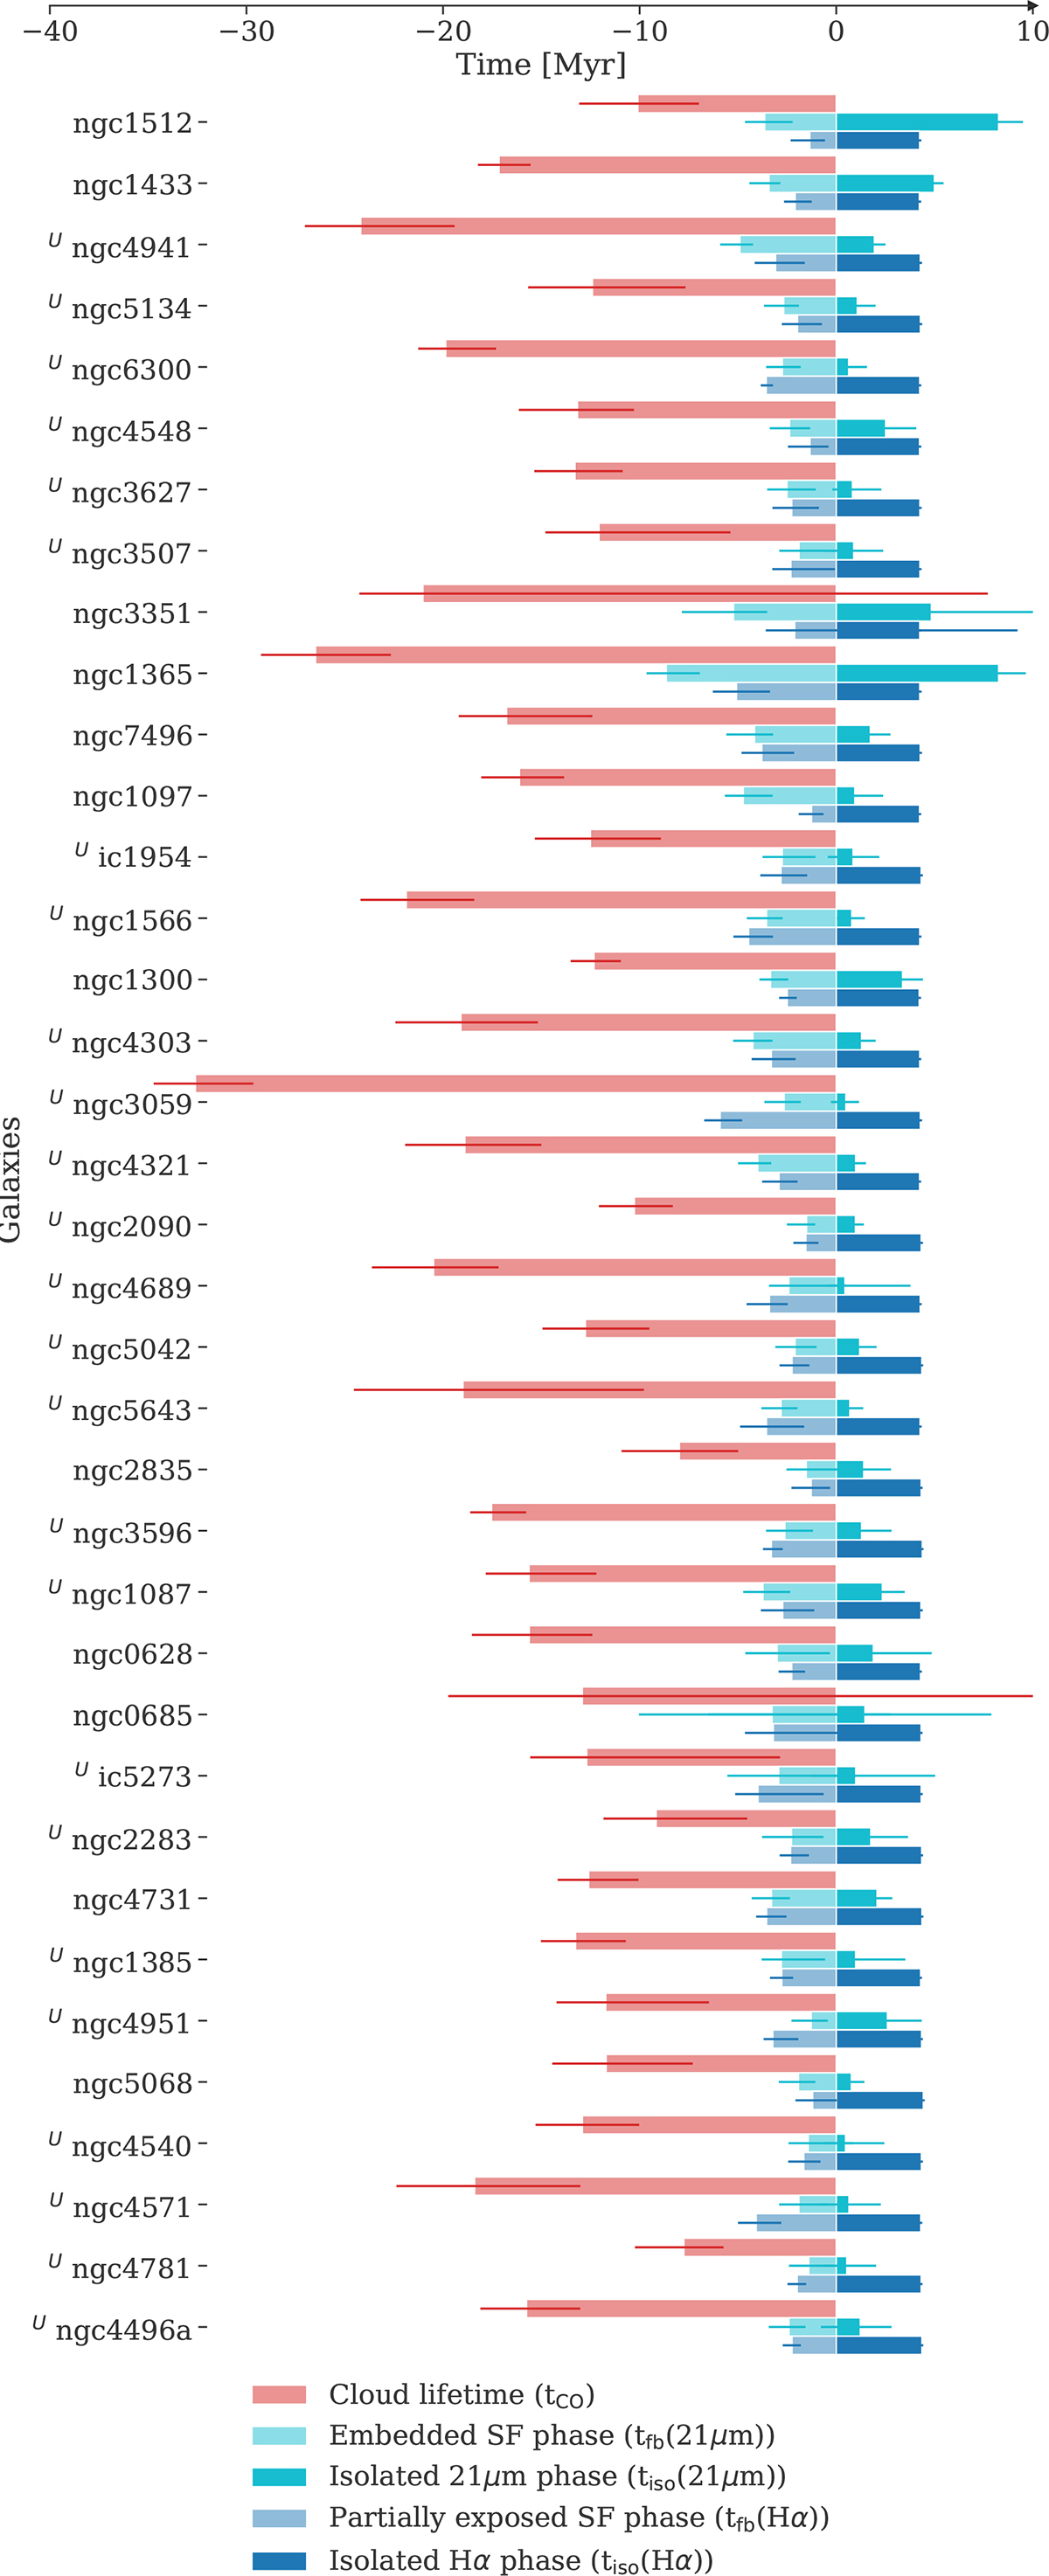
Typical evolutionary timescales in our sample evolving from an inert CO-emitting phase to an embedded star-forming phase traced with 21 μm and eventually to an exposed star-forming phase traced with Hα emission. The feedback timescale tfb, 21 μm is an upper limit in 25 out of 37 galaxies, which are flagged with U. The upper and lower errorbars associated with each phase of the evolutionary cycle are shown as thin lines, with the same color. Galaxies are ordered by their Hubble morphological type.
Current usage metrics show cumulative count of Article Views (full-text article views including HTML views, PDF and ePub downloads, according to the available data) and Abstracts Views on Vision4Press platform.
Data correspond to usage on the plateform after 2015. The current usage metrics is available 48-96 hours after online publication and is updated daily on week days.
Initial download of the metrics may take a while.