Fig. 6.
Download original image
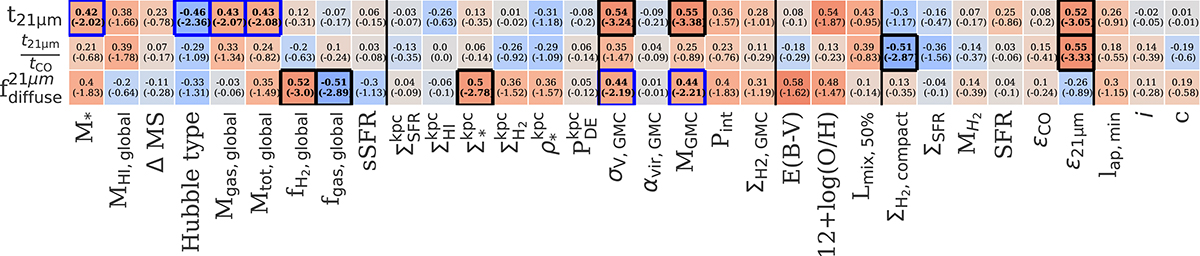
Spearman’s rank correlation coefficients and associated p-values measured between galaxy properties (columns) and our measurements (rows). Statistically significant correlations according to the Holm-Bonferroni method (described in Section 4.2.2) are highlighted as black squares, and marginally significant correlations (log p-values < –2) are shown as blue squares. Our measurements are the total timescale of 21 μm emission (t21 μm), the ratio between timescales of SFR and gas(t21 μm/tCO), and the diffuse emission fractions of 21 μm (f![]() ). We correlate these measurements with various parameters grouped in six categories, described in Section 4.2.1, along with the corresponding references.
). We correlate these measurements with various parameters grouped in six categories, described in Section 4.2.1, along with the corresponding references.
Current usage metrics show cumulative count of Article Views (full-text article views including HTML views, PDF and ePub downloads, according to the available data) and Abstracts Views on Vision4Press platform.
Data correspond to usage on the plateform after 2015. The current usage metrics is available 48-96 hours after online publication and is updated daily on week days.
Initial download of the metrics may take a while.