Fig. 7.
Download original image
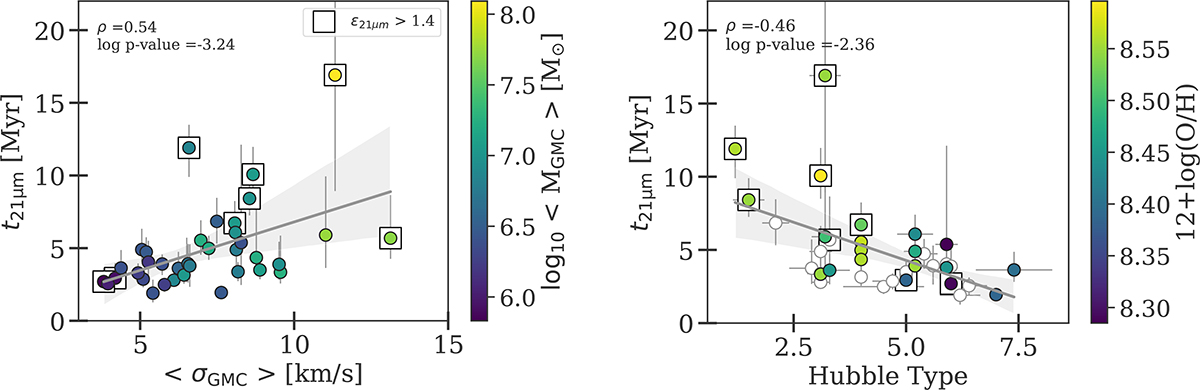
Dependencies of the total duration of the 21 μm emitting phase (t21 μm). Left: Total duration of the 21 μm vs. CO-luminosity-weighted average velocity dispersion of GMCs. The color bar shows the CO luminosity-weighted average mass of GMCs. Galaxies with high surface density contrasts are identified with squares. We show in gray a linear regression fitted to the data and the gray-shaded area represents the 95% confidence interval on the regression, obtained with bootstrapping data. Right: Total duration of the 21 μm vs. the Hubble morphological type. The color bar shows the metallicity measurements for the galaxies observed with MUSE.
Current usage metrics show cumulative count of Article Views (full-text article views including HTML views, PDF and ePub downloads, according to the available data) and Abstracts Views on Vision4Press platform.
Data correspond to usage on the plateform after 2015. The current usage metrics is available 48-96 hours after online publication and is updated daily on week days.
Initial download of the metrics may take a while.