Fig. 1
Download original image
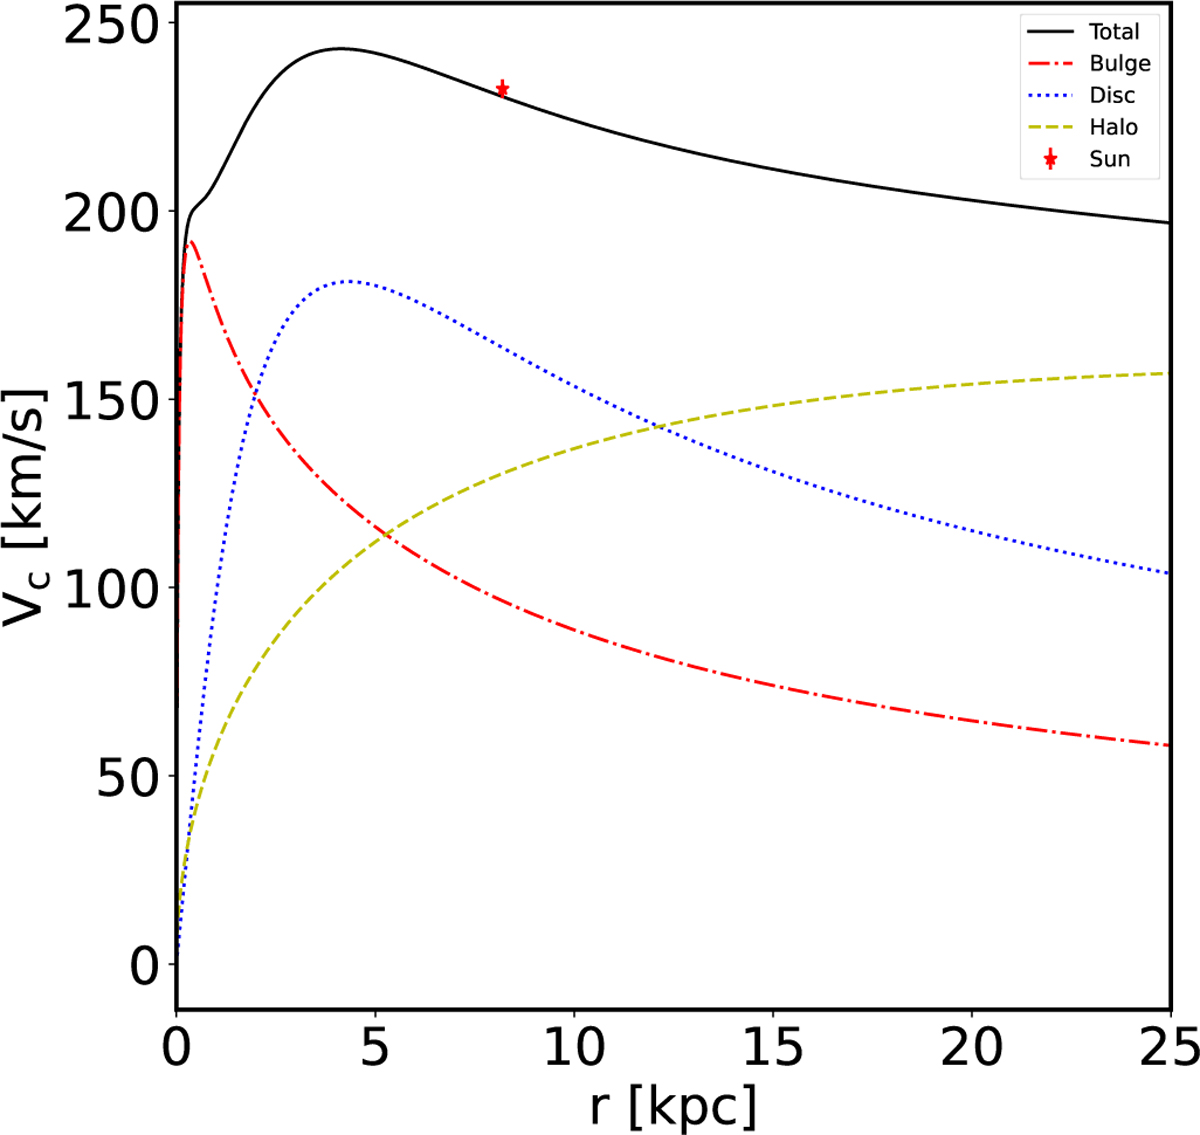
Rotational curve of the MW. The solid black line shows the velocity of the full potential model, the dashed yellow line indicates the contribution from the halo component, the dotted blue line shows the total contribution from the discs and the dash-dotted red line the contribution from the bulge (bar and spheroid). The red symbol with error bar represents the Sun.
Current usage metrics show cumulative count of Article Views (full-text article views including HTML views, PDF and ePub downloads, according to the available data) and Abstracts Views on Vision4Press platform.
Data correspond to usage on the plateform after 2015. The current usage metrics is available 48-96 hours after online publication and is updated daily on week days.
Initial download of the metrics may take a while.