Fig. 8.
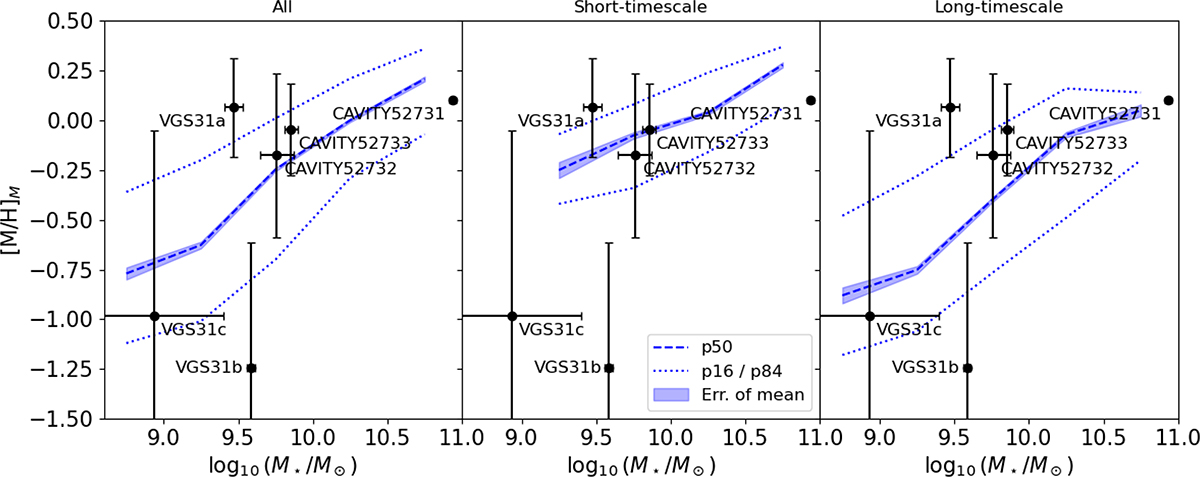
Download original image
Mass-metallicity relation for the galaxies in our sample. In blue we have the MMR for void galaxies, taken from Domínguez-Gómez et al. (2023a). The dashed lines are the mean values, the shaded regions are the error of the mean, and the dotted lines mark the 1σ distribution in metallicity. The MMR is shown for three different samples: all void galaxies (from CAVITY), ST-SFH void galaxies, and LT-SFH void galaxies. The black dots indicate the masses and central metallicities of the galaxies in our sample. The points are the mean of the 100 different points generated for each galaxy with Monte Carlo after perturbing the spectra and applying FADO in each of them. The error bars indicate the standard deviation of the Monte Carlo generated sample.
Current usage metrics show cumulative count of Article Views (full-text article views including HTML views, PDF and ePub downloads, according to the available data) and Abstracts Views on Vision4Press platform.
Data correspond to usage on the plateform after 2015. The current usage metrics is available 48-96 hours after online publication and is updated daily on week days.
Initial download of the metrics may take a while.