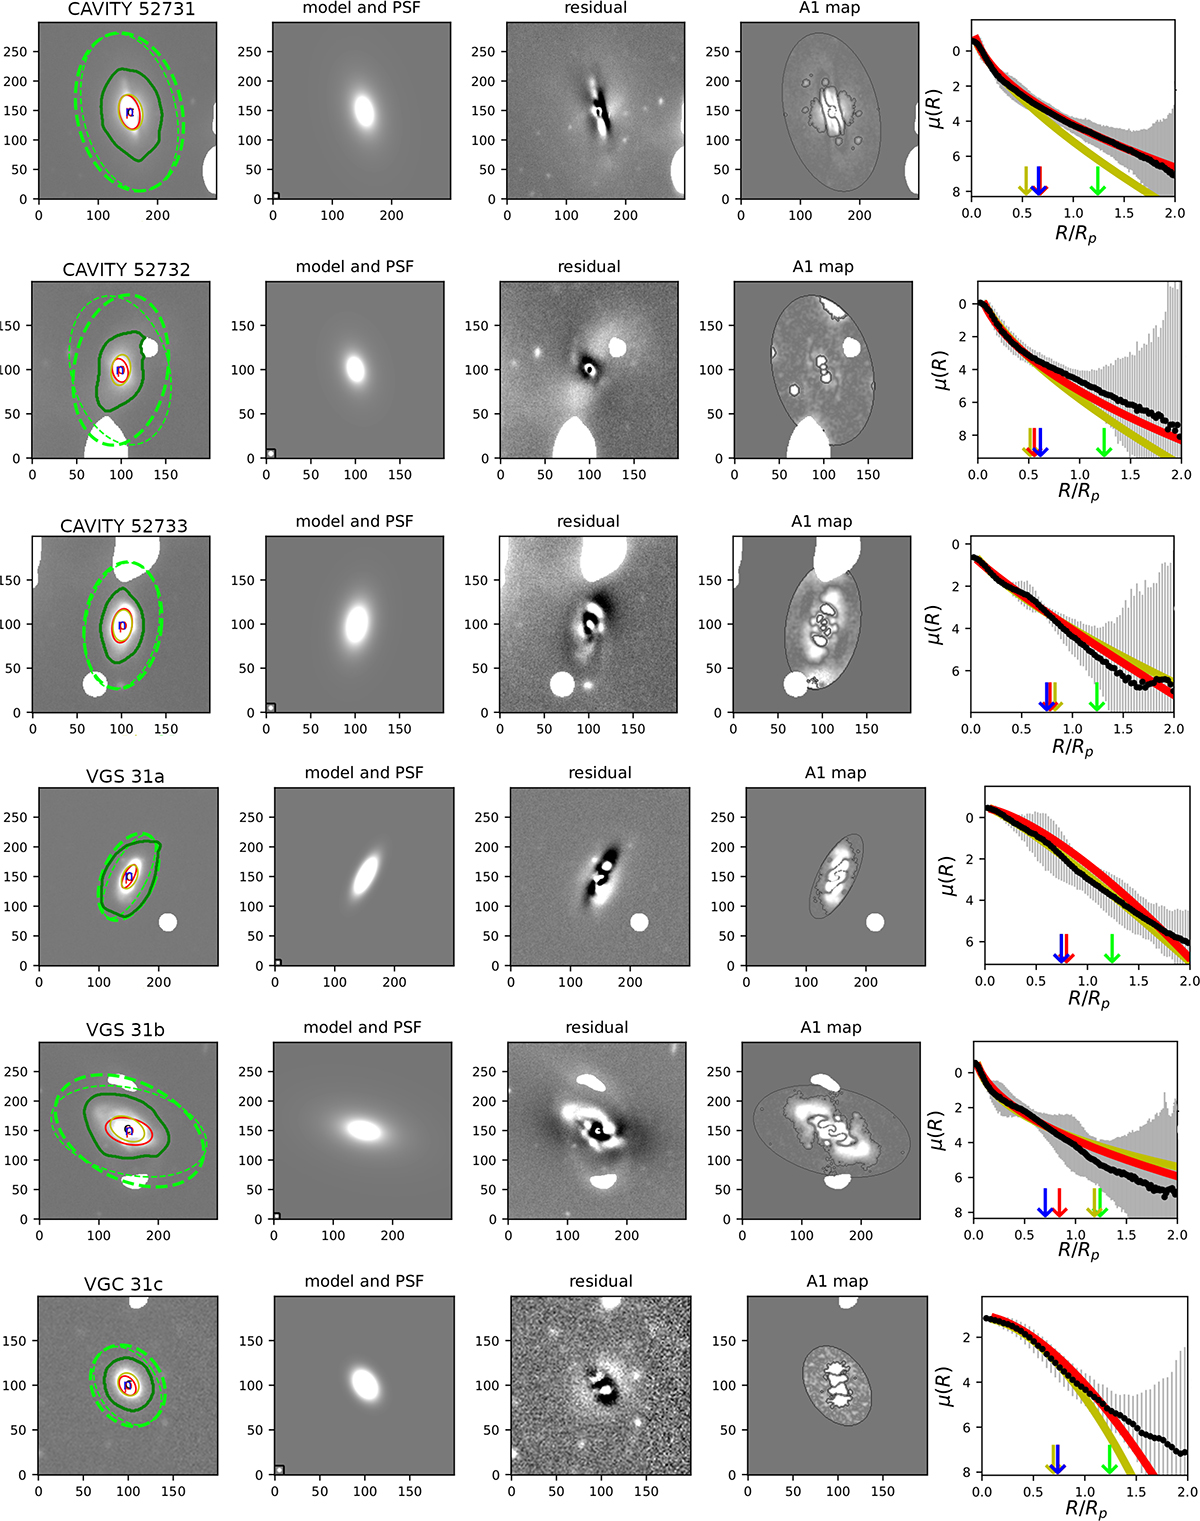
Fig. 9.
Download original image
MORFOMETRYKA output for CAVITY 52731 (upper row), CAVITY 52732 (middle), and CAVITY 52733 (lower). In the columns, from left to right: original image in g band (arcsinh scale); single Sérsic model fit and PSF (lower left insert); single Sérsic residual; asymmetry map; and brightness profile (black dots) and 1D (yellow) and 2D (red) derived Sérsic models. In the leftmost panels, the dark green line is the initial segmentation region; the neon green lines are the two Petrosian radius regions (obtained both by fitting Sérsic and by image momenta); the red line corresponds to the Sérsic Rn. In the rightmost panels, black dots and bars are measurements and associated uncertainties; the yellow line is the Sérsic fit to the 1D profile; the red line is the profile but with the parameters obtained from the image (2D) fits.
Current usage metrics show cumulative count of Article Views (full-text article views including HTML views, PDF and ePub downloads, according to the available data) and Abstracts Views on Vision4Press platform.
Data correspond to usage on the plateform after 2015. The current usage metrics is available 48-96 hours after online publication and is updated daily on week days.
Initial download of the metrics may take a while.