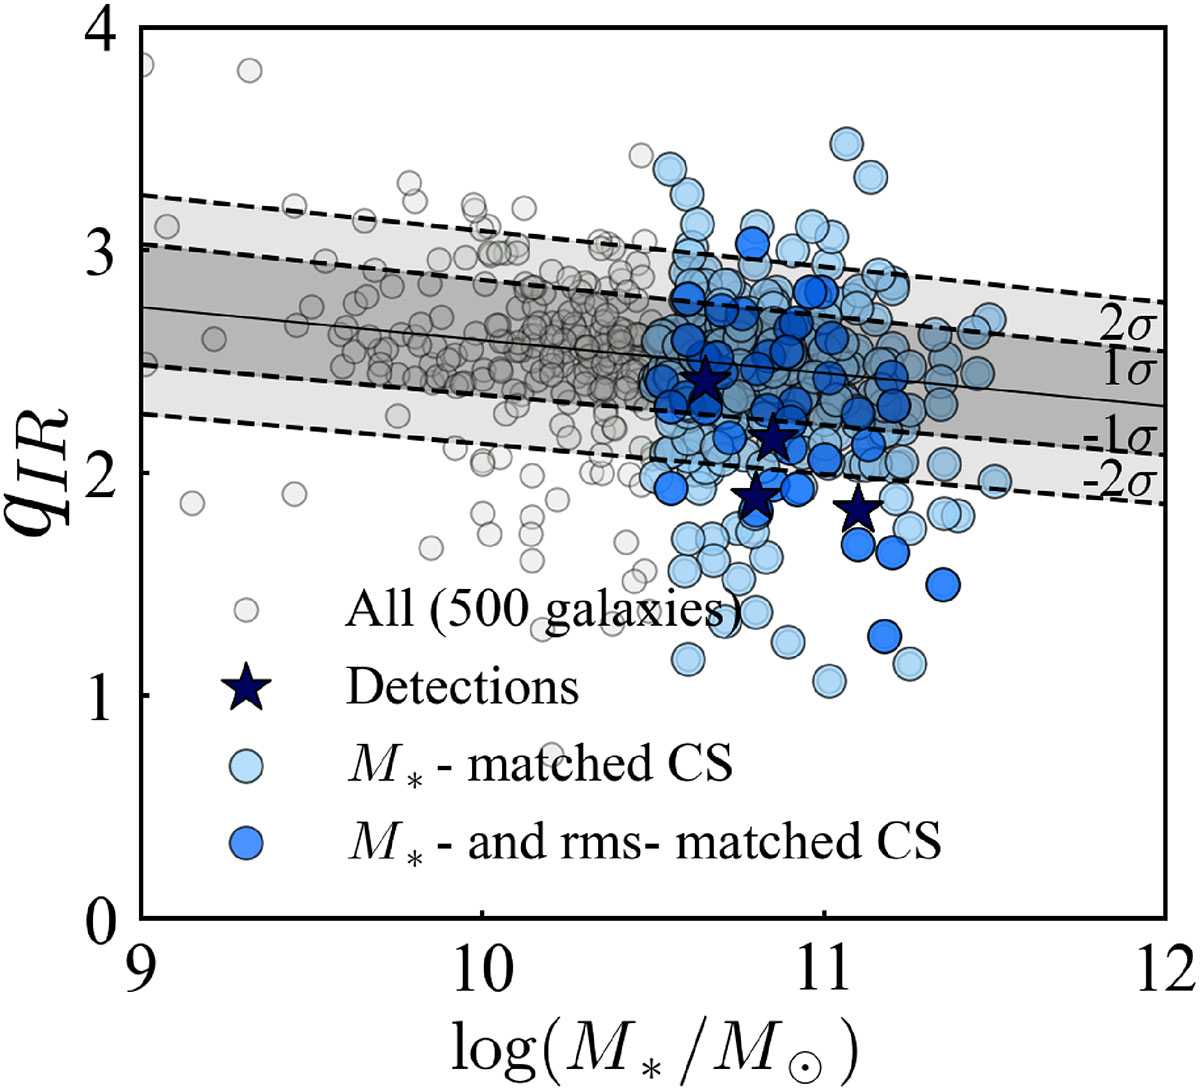
Fig. 2.
Download original image
qIR distribution as function of host galaxy stellar mass for all 500 targets (gray points), four VLBA-detected AGNs (blue stars), and 277 non-detections part of the M★-matched sample (light blue points). The qIR of the detections account for the AGN emission detected by the VLBA (e.g., qIR, corr). The darker blue points are the 42 non-detections observed at sensitivities equal to or lower than the sensitivity of the detections, thus constituting the (M*, rms)- matched CS. The black line is the qIR versus log M★/M⊙ relation from Delvecchio et al. (2021) at ⟨z⟩∼1, and the shaded areas span the scatter of the IRRC at M★ > 1010.5 M⊙ from Delvecchio et al. (2021), of around ±0.22 dex and ±0.44 dex.
Current usage metrics show cumulative count of Article Views (full-text article views including HTML views, PDF and ePub downloads, according to the available data) and Abstracts Views on Vision4Press platform.
Data correspond to usage on the plateform after 2015. The current usage metrics is available 48-96 hours after online publication and is updated daily on week days.
Initial download of the metrics may take a while.